Fluent Metrics Library Overview
Essential knowledge
Intended Audience:
Business User
Author:
Movyn John
Changed on:
16 Jan 2026
Overview
The Fluent Metrics Library is a collection of metrics and dashboards available to Fluent customers. Delivered through the Fluent Analytics feature, it gives retailers real-time visibility into order, fulfillment, returns, and inventory operations to enable faster, smarter decisions.Designed for retail operations managers, inventory analysts, business intelligence, and many other teams who need visibility across retail operations.
Key points
- Operational clarity - get a clear view of what's working and what needs attention across your network.
- Proactive issue management - quickly detect spikes in cancellations, rejections, or delays.
- Continuous optimization - track key metrics across locations, channels and fulfillment types to drive improvements.
- Data-driven decisions - support trade planning, performance reviews and customer experiences with real-time data.
The Fluent Metrics Library is be available via Fluent Analytics. The metrics are organized by the domains of Order, Fulfillment, Inventory, and Returns.Each dashboard has filters available to further drill down on the metrics.Each metric below describes the calculation logic and reference statuses initially configured. These statuses are configurable within each metric's component in the relevant manifest document setting.
Order Dashboard
Purpose: Monitor overall order performance and identify trends in order volume, value, and processing issues.Key Benefits:- Operational clarity - get a clear view of what's working and what needs attention across your network
- Proactive issue management - detect spikes in cancellations, rejections, or delays
- Continuous optimization - track key metrics across locations, channels and fulfillment types to drive improvements
- Data-driven decisions - support trade planning, performance reviews and customer experiences with real-time data
- Date
- Retailer
- Order Type
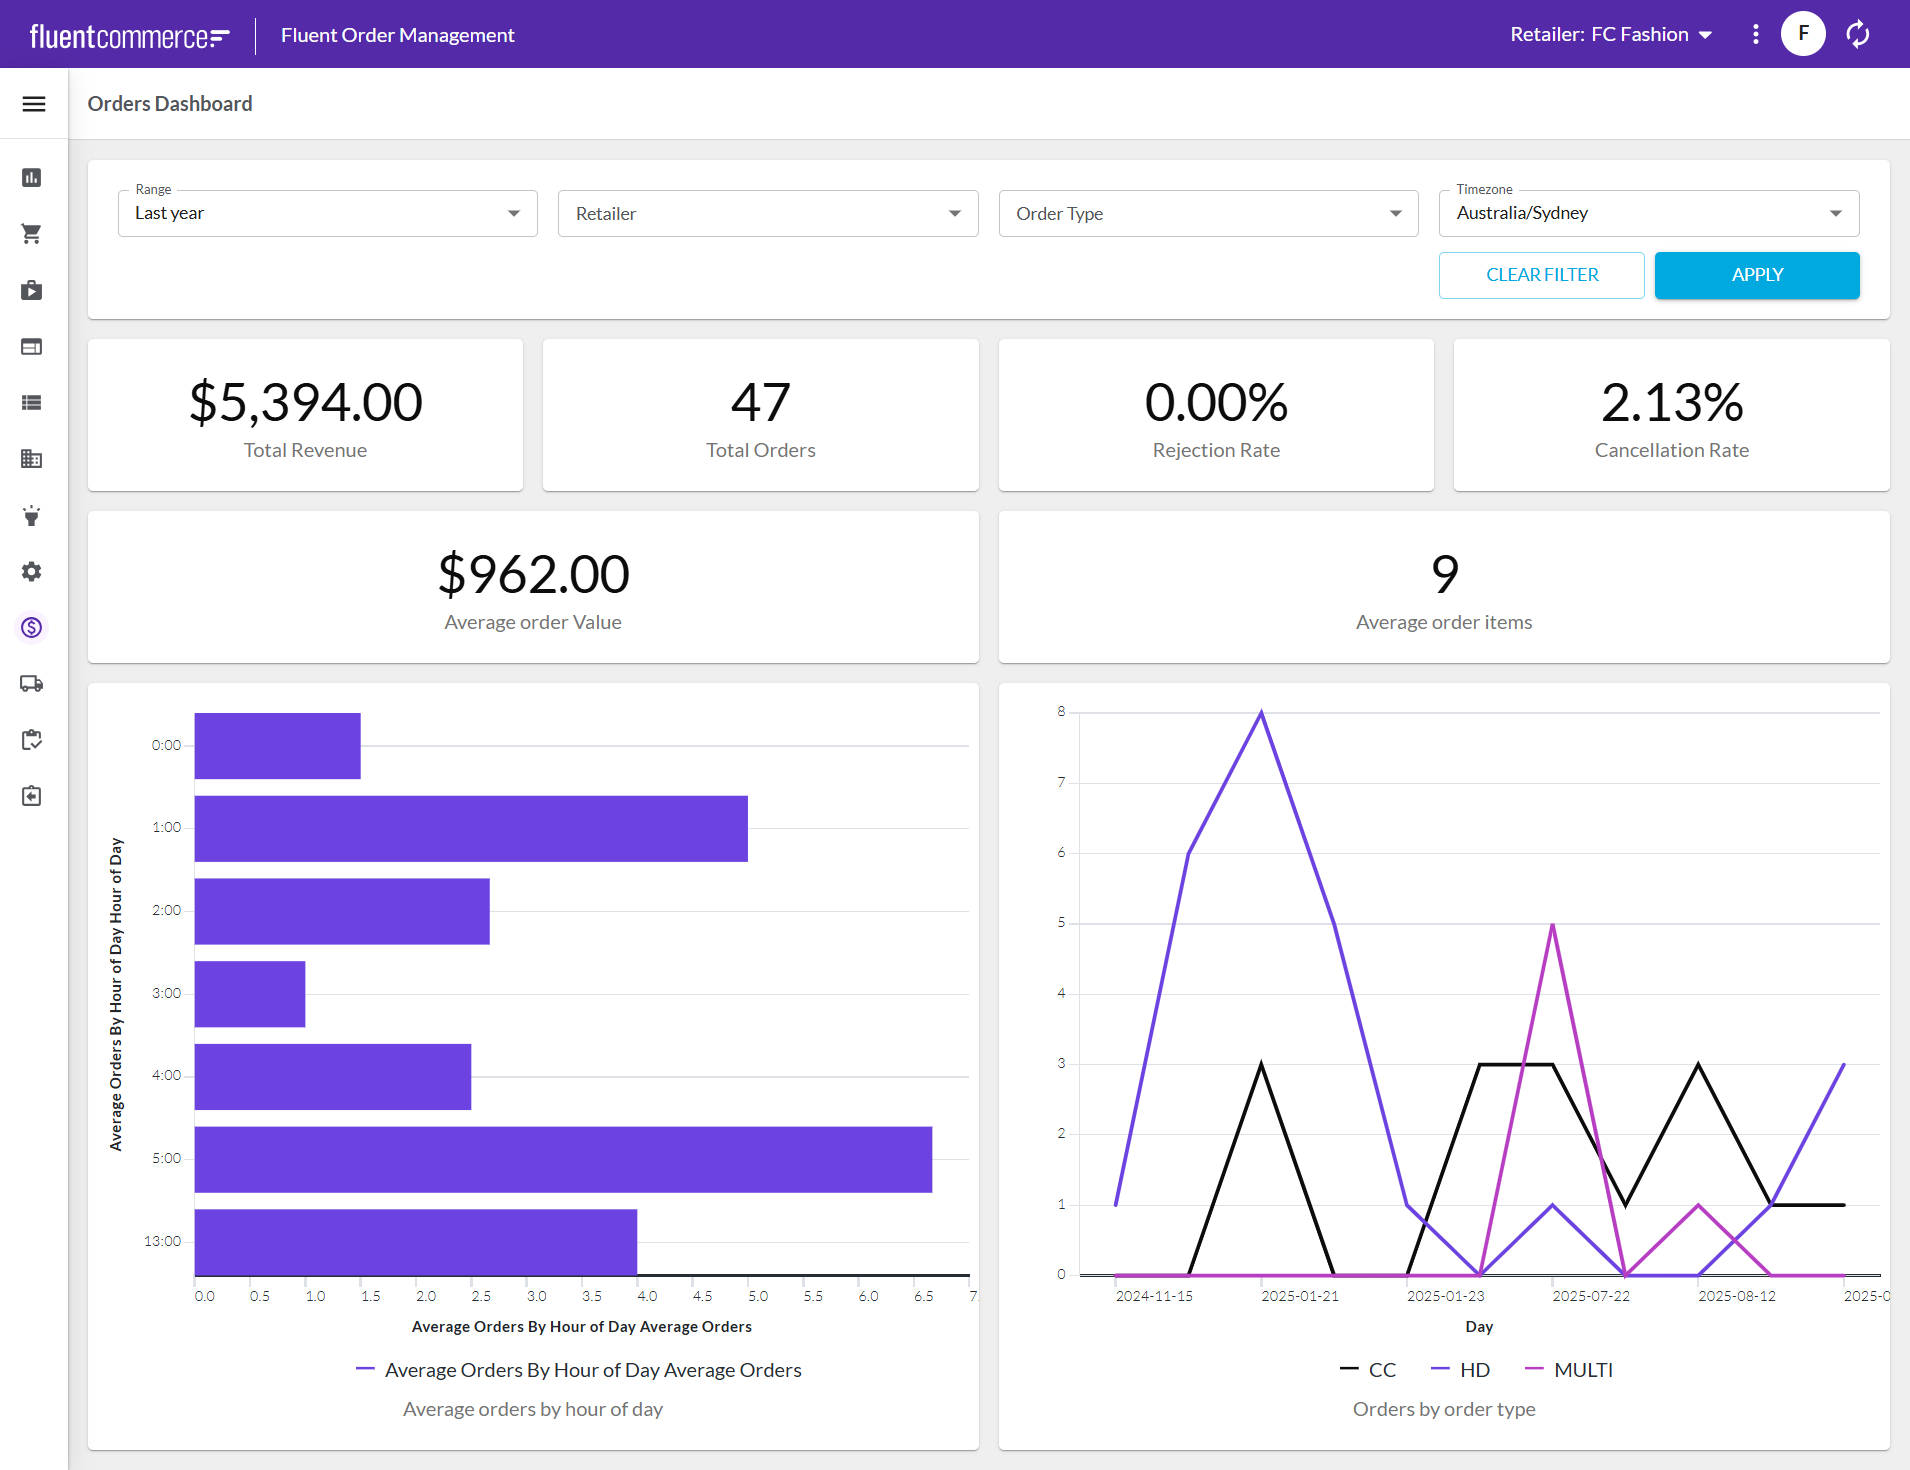
| Metric | What it measures |
| Total Revenue | Total value of all orders |
| Total Orders | Number of orders received |
| Cancellation Rate | Percentage of orders cancelled |
| Average Order Value | Revenue divided by number of orders |
| Average Order Items | Items per order |
| Average Orders by Hour of Day | Average number of orders received during each hour of the day |
| Orders by Order Type | Breakdown by channel or order category |
- Rising rejection or cancellation rates indicate operational issues
- Declining average order value may signal pricing or product mix problems
- Order volume patterns help with capacity planning
Fulfillment Dashboard
Purpose: Monitor and optimize fulfillment operations from order assignment through completion.Key Benefits:- Fulfillment visibility - track progress of orders through each fulfillment stage
- Bottleneck identification - quickly spot where fulfillments are getting stuck or delayed
- Performance optimization - measure fulfillment speed and success rates across locations
- Resource planning - understand fulfillment capacity and demand patterns
- Date
- Retailer
- Location
- Product
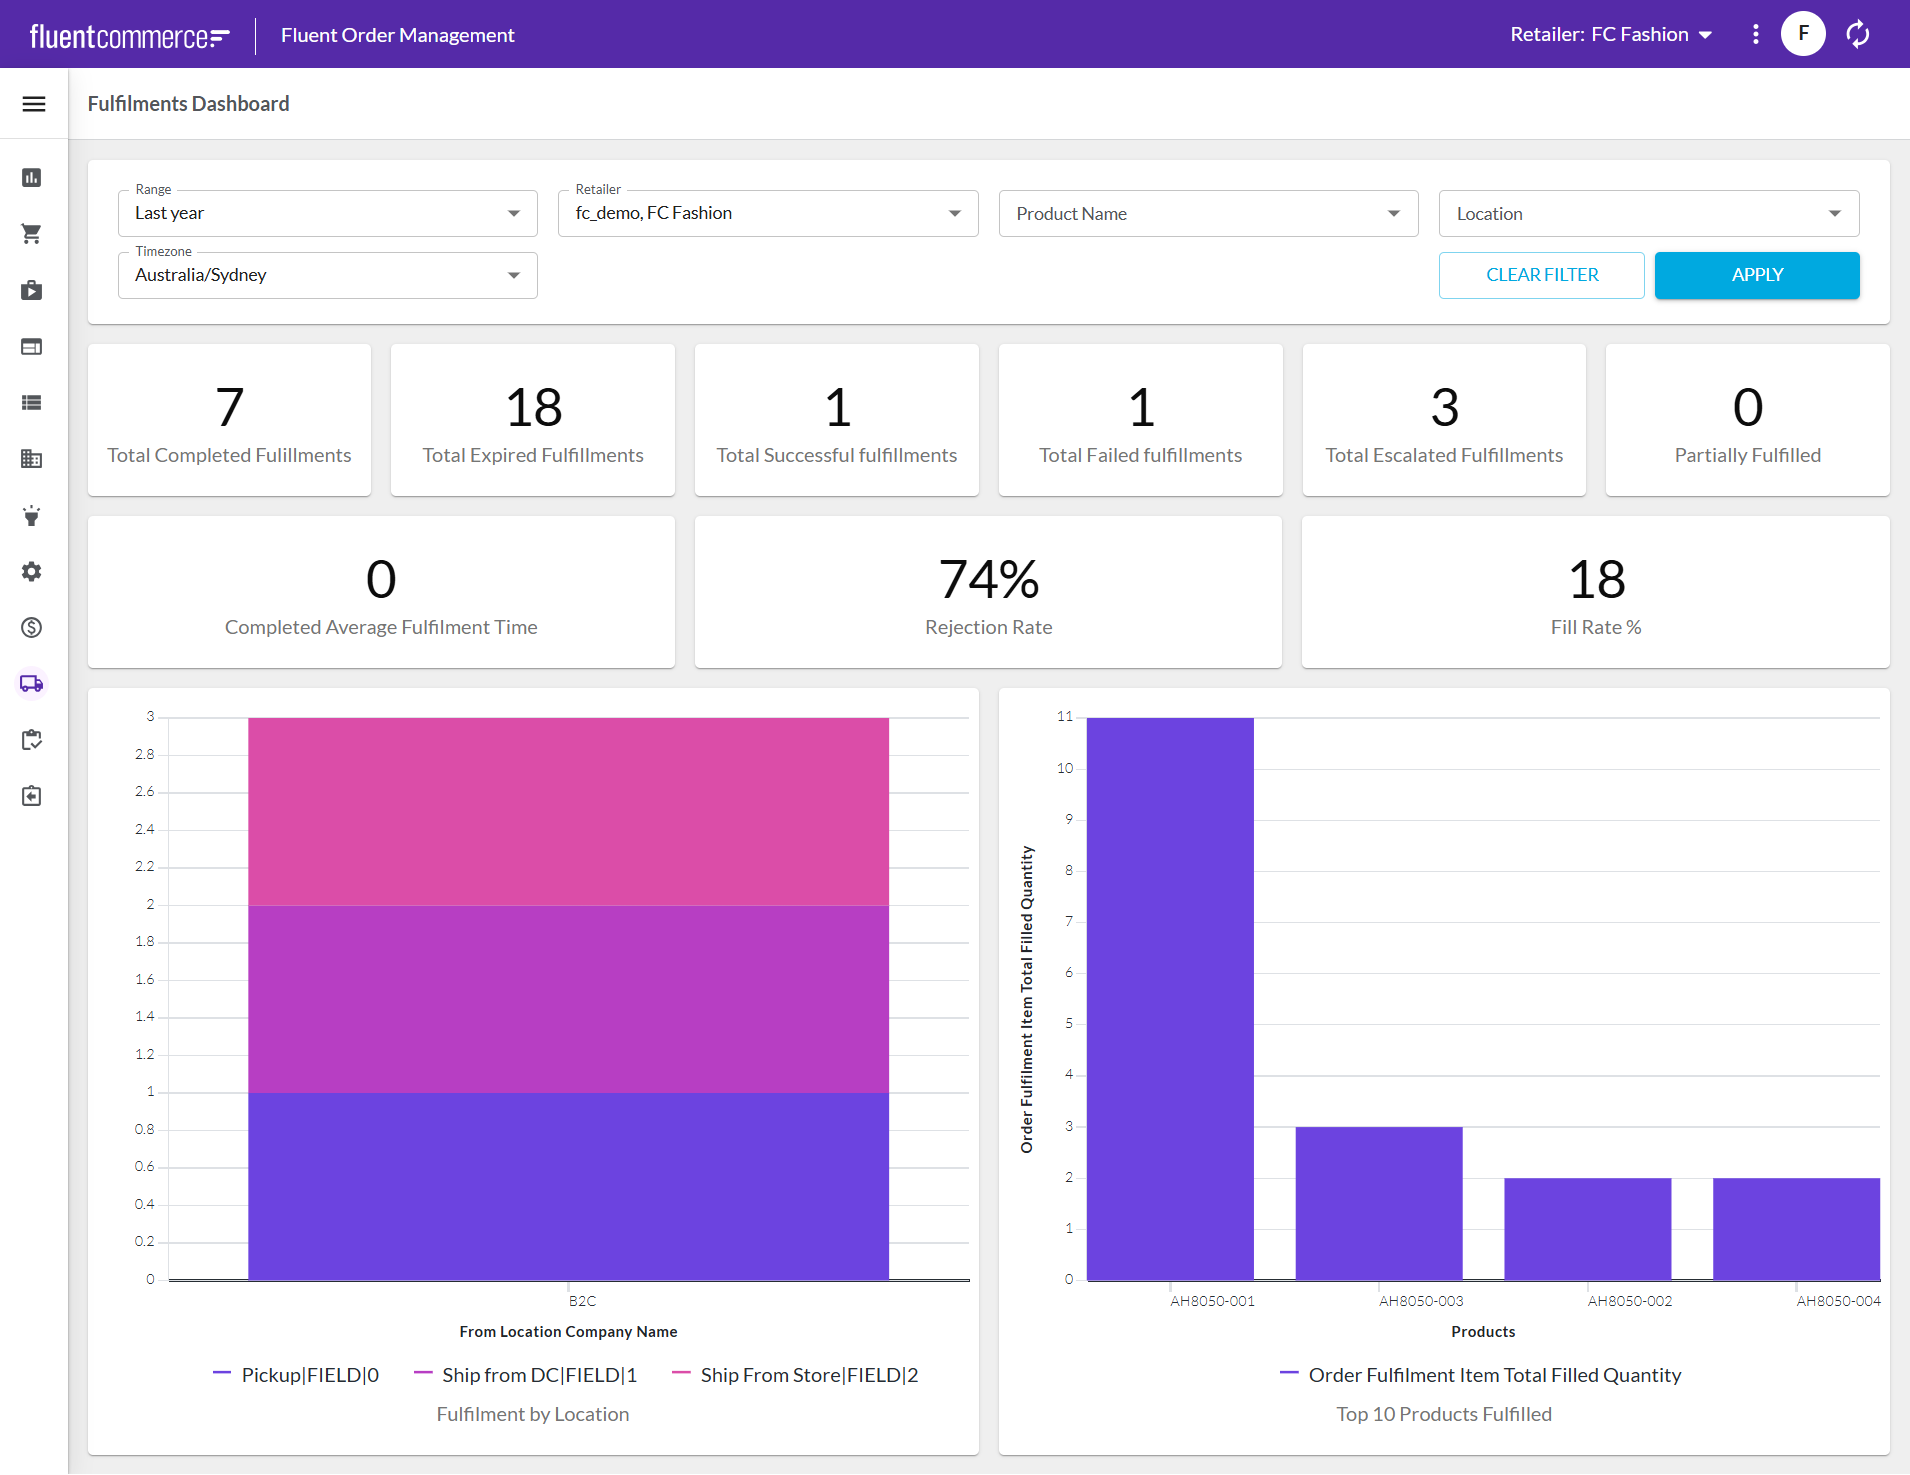
| Metric | What it measures |
| Total Completed Fulfillments | Number of fulfillments successfully completed |
| Total Expired Fulfillments | Number of fulfillments that timed out before completion |
| Total Fulfilled Fulfillments | Number of fulfillments fulfilled without issues |
| Total Failed Fulfillments | Number of fulfillments that failed during processing |
| Total Escalated Fulfillments | Number of fulfillments requiring manual intervention |
| Total Partially Completed Fulfillments | Number of fulfillments completed with some items missing (short pick) |
| Average Fulfillment Time | Average time from fulfillment assignment to completion |
| Item Rejection Rate | Percentage of item quantities rejected across locations |
| Fill Rate | Percentage of order items successfully fulfilled |
| Fulfillments By Location | Number of fulfillments completed at each location |
| Top 10 Products Fulfilled | Most frequently fulfilled products by volume |
- High rejection rates may indicate inventory accuracy issues
- Long fulfillment times could signal operational bottlenecks
- Low fill rates suggest stock availability problems
Inventory Dashboard
Purpose: Monitor inventory levels, movement, and performance across all locations and products.Key Benefits:- Stock visibility - real-time view of inventory levels and availability across locations
- Demand forecasting - track product velocity and sales patterns for better planning
- Inventory optimization - identify slow-moving stock and optimize inventory investment
- Operational efficiency - monitor inventory corrections and accuracy metrics
- Date
- Retailer
- Location
- Product
- Inventory Catalog
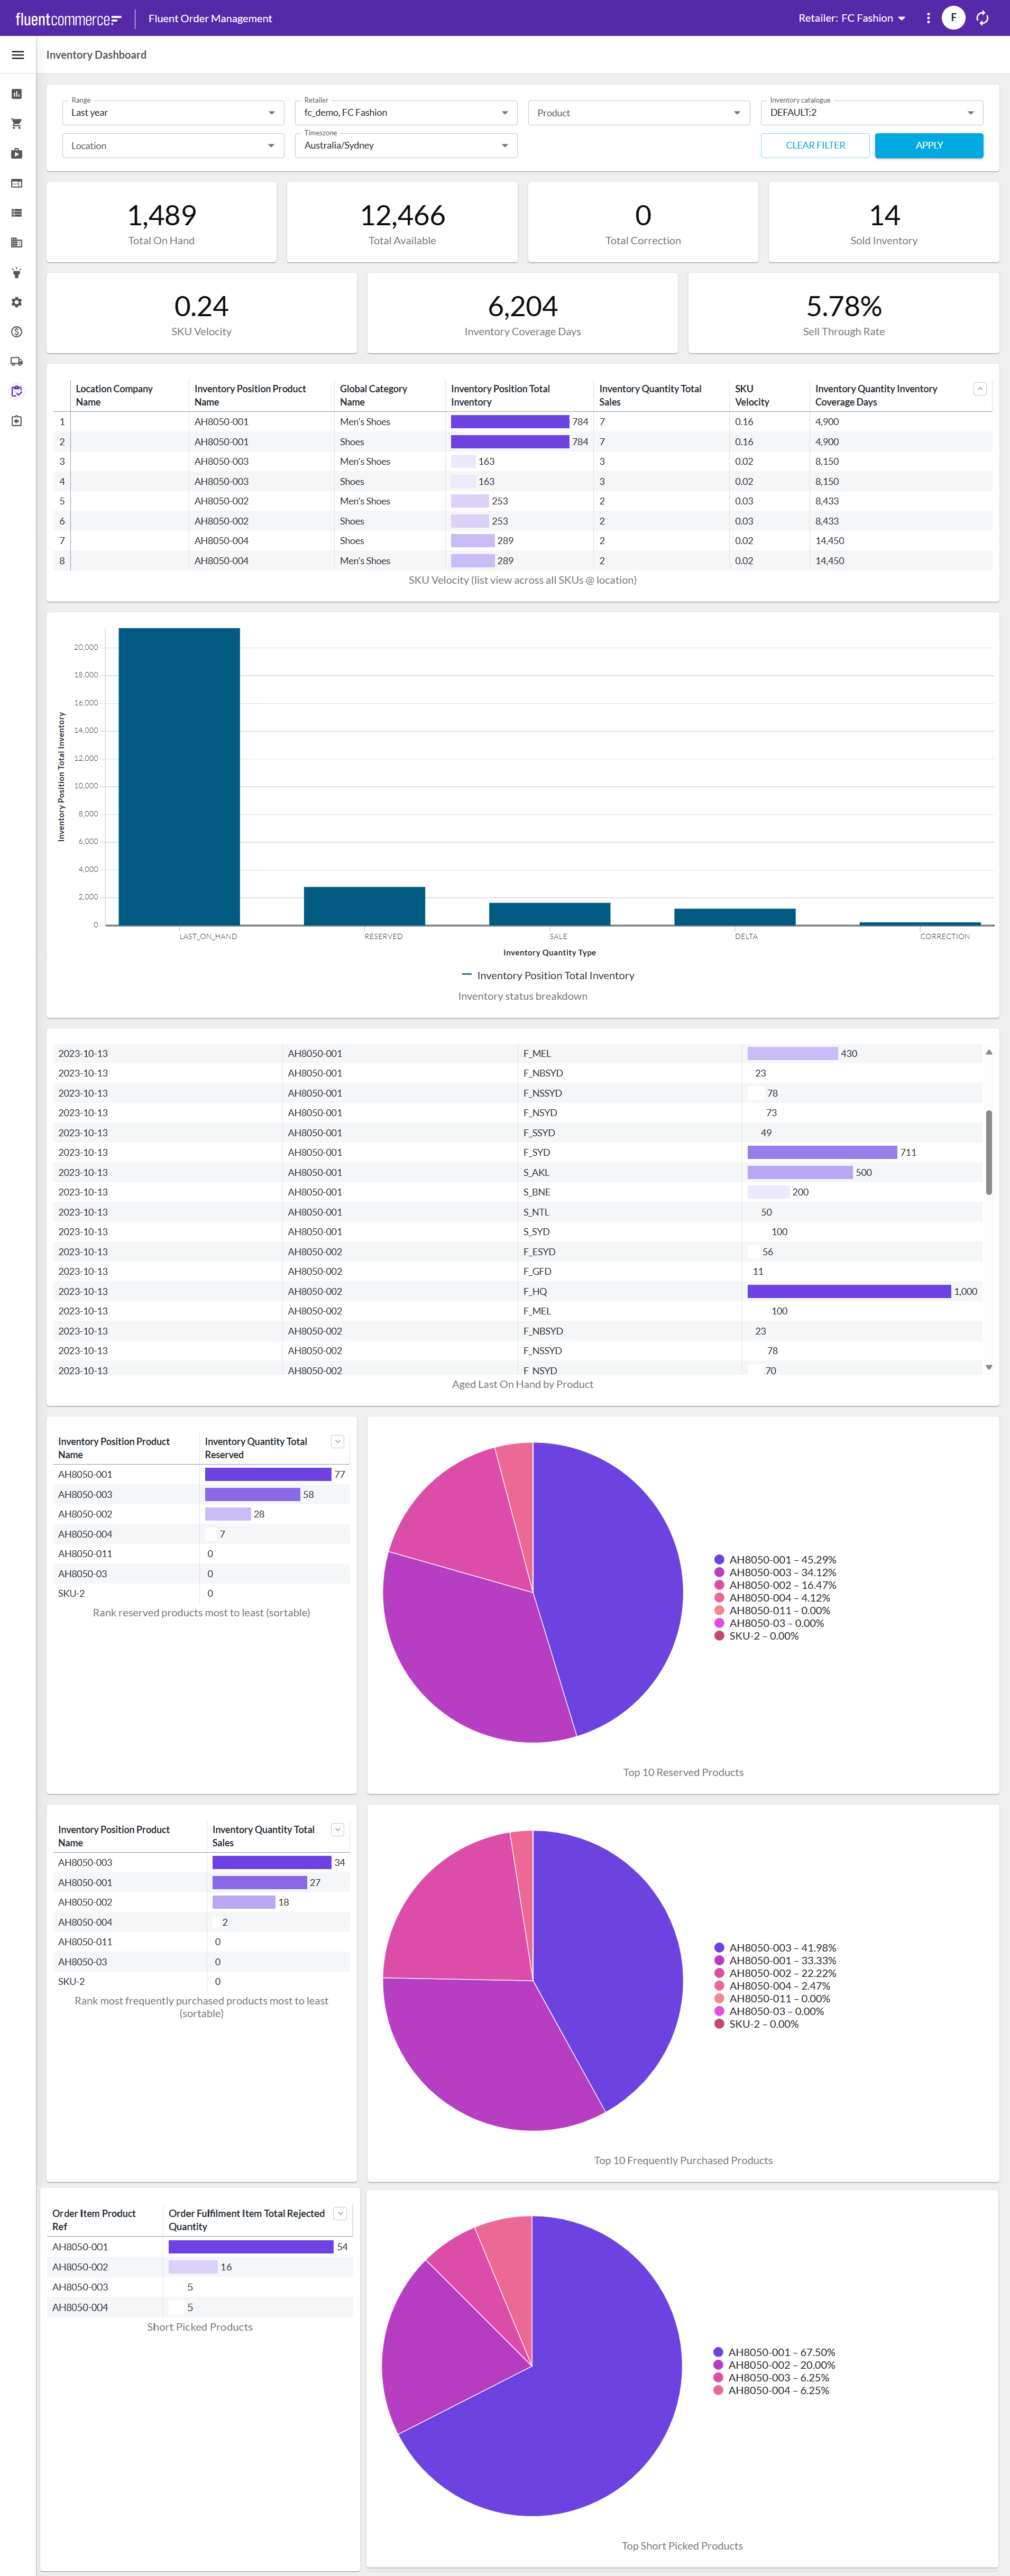
| Metric | What it measures |
| Total On Hand | Total physical inventory currently available across all locations |
| Total Available | Inventory available for sale (excluding reserved, damaged, or allocated stock) |
| Total Correction | Total inventory adjustments made to correct discrepancies between system and physical counts |
| Sold Inventory | Total inventory units sold during the selected time period |
| SKU Velocity | Rate at which products are selling over time |
| SKU Velocity (list view) | Rate at which individual products are selling over time, grouped by their product ref |
| Inventory Coverage Days | Number of days current inventory will last at current sales velocity |
| Sell Through Rate | Percentage of inventory sold during a specific time period |
| Inventory Quantity Type Breakdown | Breakdown of total inventory by categories (last on hand, reserved, sale, etc.) |
| Top 10 Reserved Products | Products with the highest levels of reserved inventory |
| Top 10 Purchased Products | Products purchased most often by customers (by transaction frequency) |
| Top 10 Short Picked Products | Products most frequently short-picked due to insufficient inventory or product issues (e.g. damaged) |
- Low coverage days indicate potential stock-outs
- High correction volumes suggest inventory accuracy issues
- Slow SKU velocity identifies a potential opportunity to optimise the order sourcing logic
Return Dashboard
Purpose: Track and analyze return patterns to improve products and reduce return rates.Key Benefits:- Return visibility - monitor return volumes, values, and processing status
- Quality insights - identify products with high return rates and common return reasons
- Financial impact - track the cost of returns on overall profitability
- Process optimization - improve return processing efficiency and customer experience
- Date
- Retailer
- Location
- Return Status
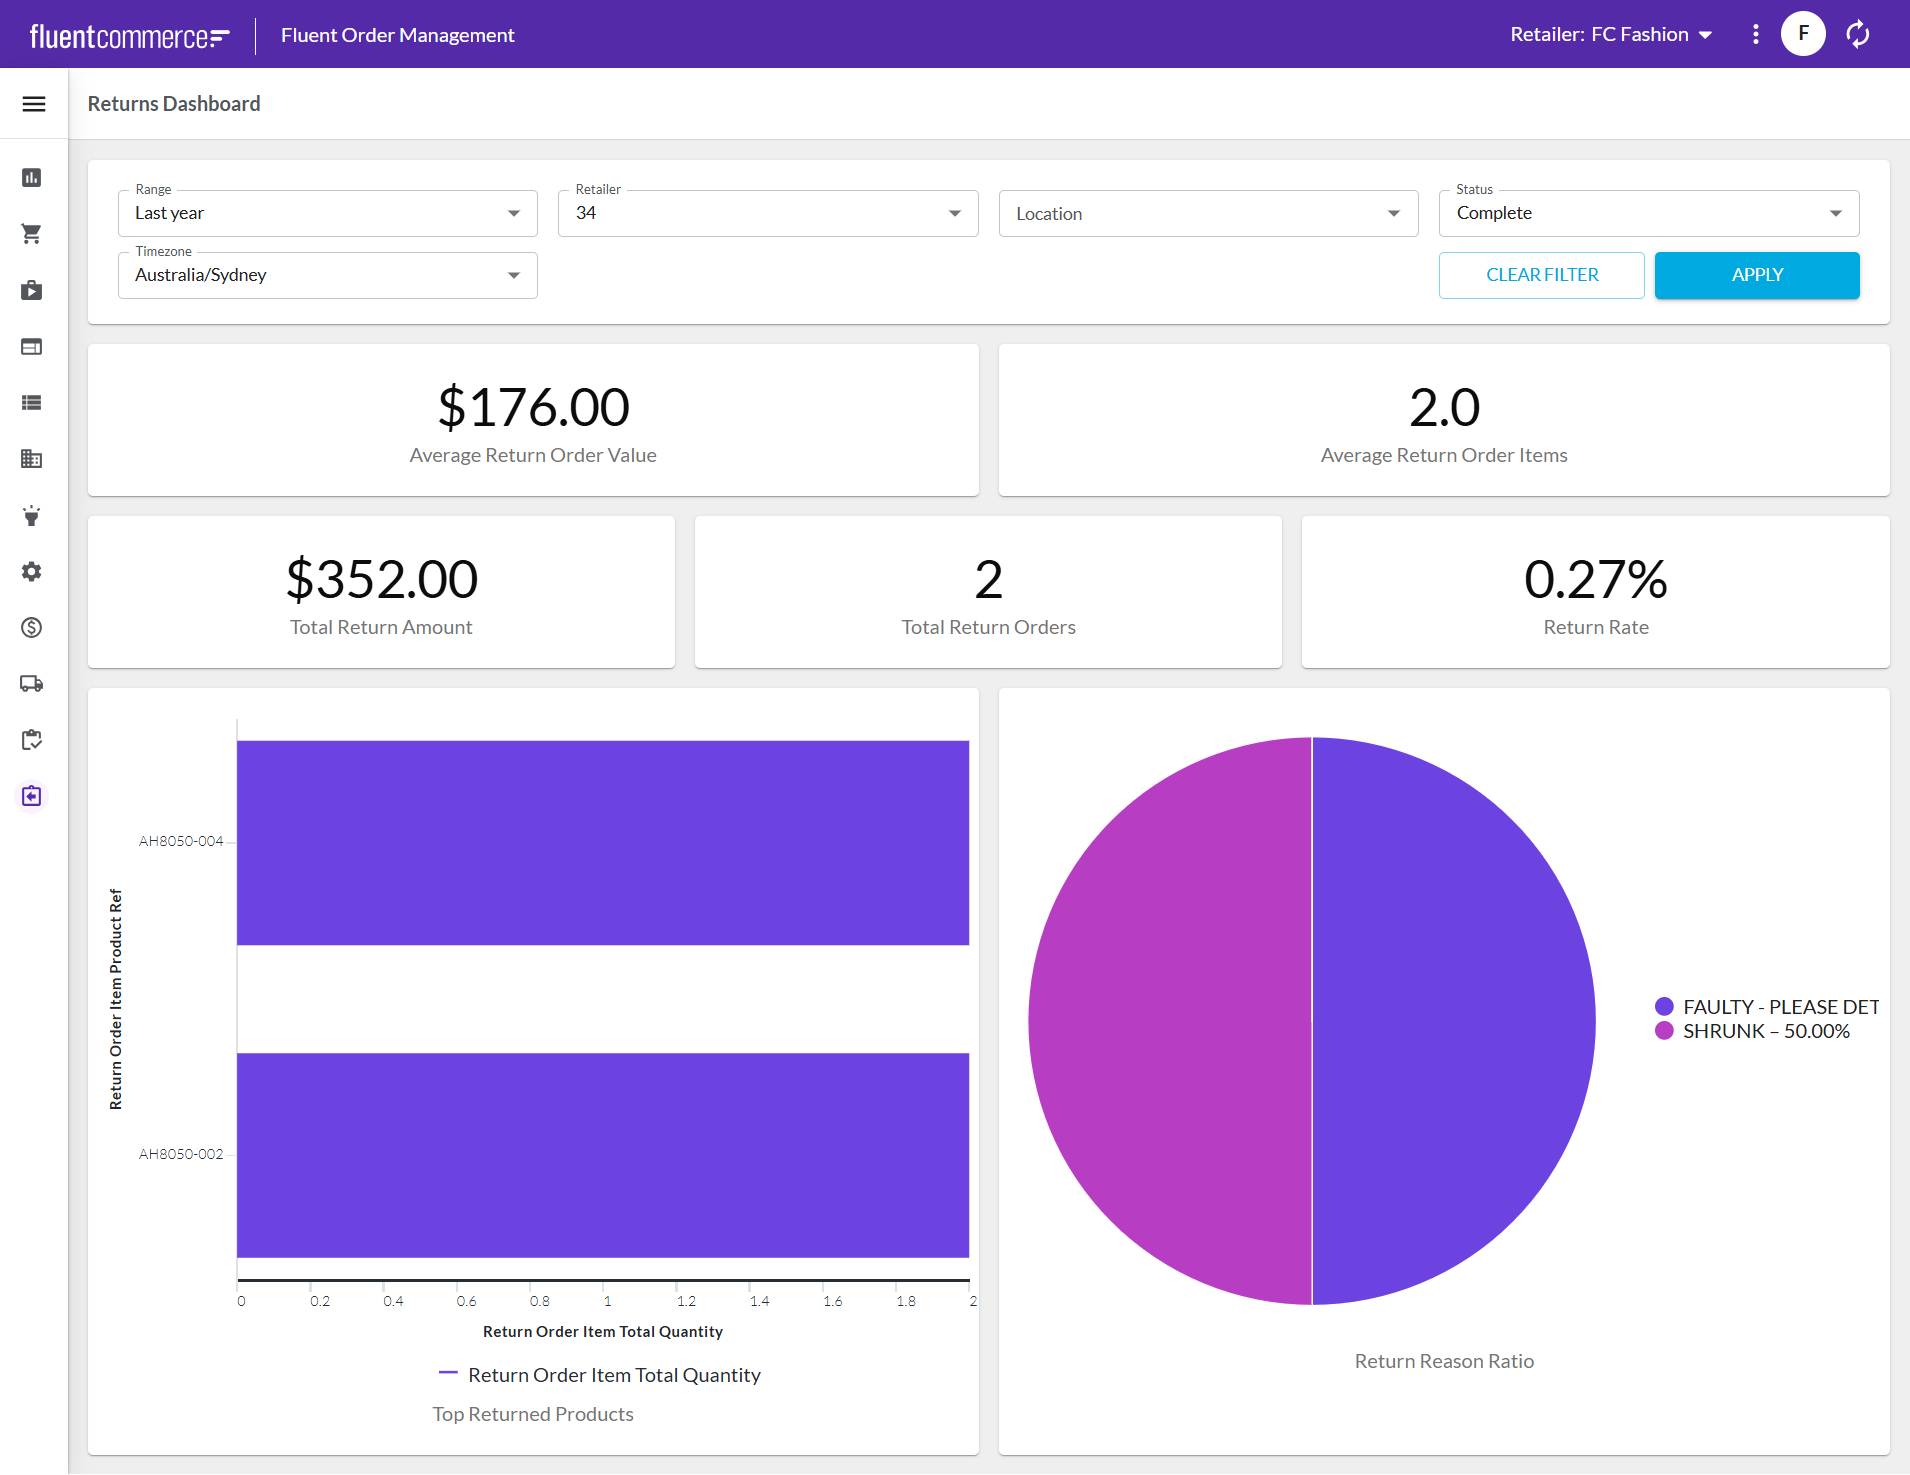
| Metric | What it measures |
| Average Return Order Value | Average dollar value per return order |
| Average Return Order Items | Average number of items per return order |
| Total Return Amount | Total dollar value of all returned products |
| Total Return Orders | Number of return requests received |
| Return Rate | Percentage of orders that result in returns |
| Top 10 Returned Products | Products with the highest return volumes for the selected time period |
| Return Reason Ratio | Breakdown of why customers return products |
- Rising return rates may indicate product quality or description issues
- High-value returns significantly impact profitability
- Return reason patterns reveal opportunities for product or process improvements