Sell Through Rate Metric
Essential knowledge
Intended Audience:
Business User
Author:
Movyn John
Changed on:
16 Jan 2026
Overview
Learn about the Sell Through Rate Metric in Fluent AnalyticsKey points
- Sell-through rates vary significantly by product lifecycle stage
- Seasonal products may show periodic high and low rates
- New products typically start with lower rates
What it measures
Percentage of inventory fulfilled compared to current physical inventory within the time period.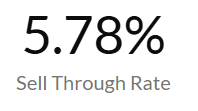
When to use this metric
- Evaluate inventory efficiency and turnover performance
- Compare product category performance
- Assess seasonal or promotional effectiveness
- Guide inventory planning and purchasing decisions
How to interpret
- Good performance: High sell-through rates indicate strong demand and efficient inventory
- Potential issues: Low rates suggest overstocking or weak demand
- Benchmark guidance: Varies by industry
Technical details
Domain:`inventory_position`Formula: (SUM(inventoryQuantity.qty where type = {TYPE_SALE}) / (inventoryPosition.onHand + SUM(inventoryQuantity.qty where type = {TYPE_SALE} and status {STATUS_ACTIVE})) * 100 within the selected time period
Reference Filter Parameters:
`inventory_catalogue.ref`: Filters the metric to inventory for the selected inventory catalogue`inventory_quantity.created_date`: Filters the metric to inventory created within the selected time period`inventory_quantity.type`: {TYPE_SALE} - Type definitions for inventory quantity sales (default: SALE)`location.ref`: Filters the metric to inventory positions from the selected location`retailer.ref`: Filters the metric to inventory positions from the selected retailer`inventory_position.product_ref`: Filters the metric to inventory positions from the selected product`inventory_quantity.conditional_status`: {STATUS_ACTIVE} - Filters the denominator half of the metric to include inventory quantities in the given statuses
`inventory_quantity.status`: Filters all inventory quantity calculations to only include inventory quantities in the given status`inventory_position.status`: Filters the inventory position calculation to only include positions in the given status