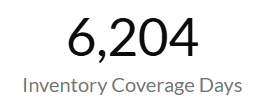
Inventory Coverage Days Metric
Essential knowledge
Intended Audience:
Business User
Author:
Movyn John
Changed on:
16 Jan 2026
Overview
Learn about the Inventory Coverage Days Metric in Fluent AnalyticsKey points
- Coverage assumes current sales velocity continues
- Seasonal and promotional events can dramatically change velocity
- Lead times must be considered in coverage planning
What it measures
Number of days current physical inventory will last for the selected products at their current SKU velocity within the time period.
When to use this metric
- Plan replenishment timing and quantities
- Identify potential stockout risks
- Optimize inventory investment levels
- Set reorder points and safety stock levels
How to interpret
- Good performance: Coverage days align with replenishment lead times plus safety margin
- Potential issues: Too few days risk stockouts; too many indicate excess investment
- Benchmark guidance: Typically 30-90 days depending on lead times and demand variability
Technical details
Domain:`inventory_position`Formula: (inventoryPosition.onHand / (SUM(inventoryQuantity.qty where type = {TYPE_SALE} within selected time period) / number_of_days) for each SKUReference Filter Parameters:`inventory_catalogue.ref`: Filters the metric to inventory for the selected inventory catalogue`inventory_quantity.created_date`: Filters the metric to inventory created within the selected time period`inventory_quantity.type`: {TYPE_SALE} - Type definitions for inventory quantity sales (default: SALE)`location.ref`: Filters the metric to inventory positions for the selected location`retailer.ref`: Filters the metric to inventory positions from the selected retailer
`inventory_quantity.status`: Filters the metric to inventory quantities in a certain status`inventory_position.status`: Filters the metric to inventory positions in a certain status
