Average Orders by Hour of Day Metric
Essential knowledge
Intended Audience:
Business User
Author:
Movyn John
Changed on:
19 Jan 2026
Overview
Learn about the Average Orders by Hour of Day Metric in Fluent AnalyticsKey points
- Time zone differences affect interpretation for multi-region retailers
- Seasonal and promotional events can significantly alter normal patterns
- Weekday vs. weekend patterns typically differ substantially
What it measures
Average number of orders created during each hour across a 24 hour period.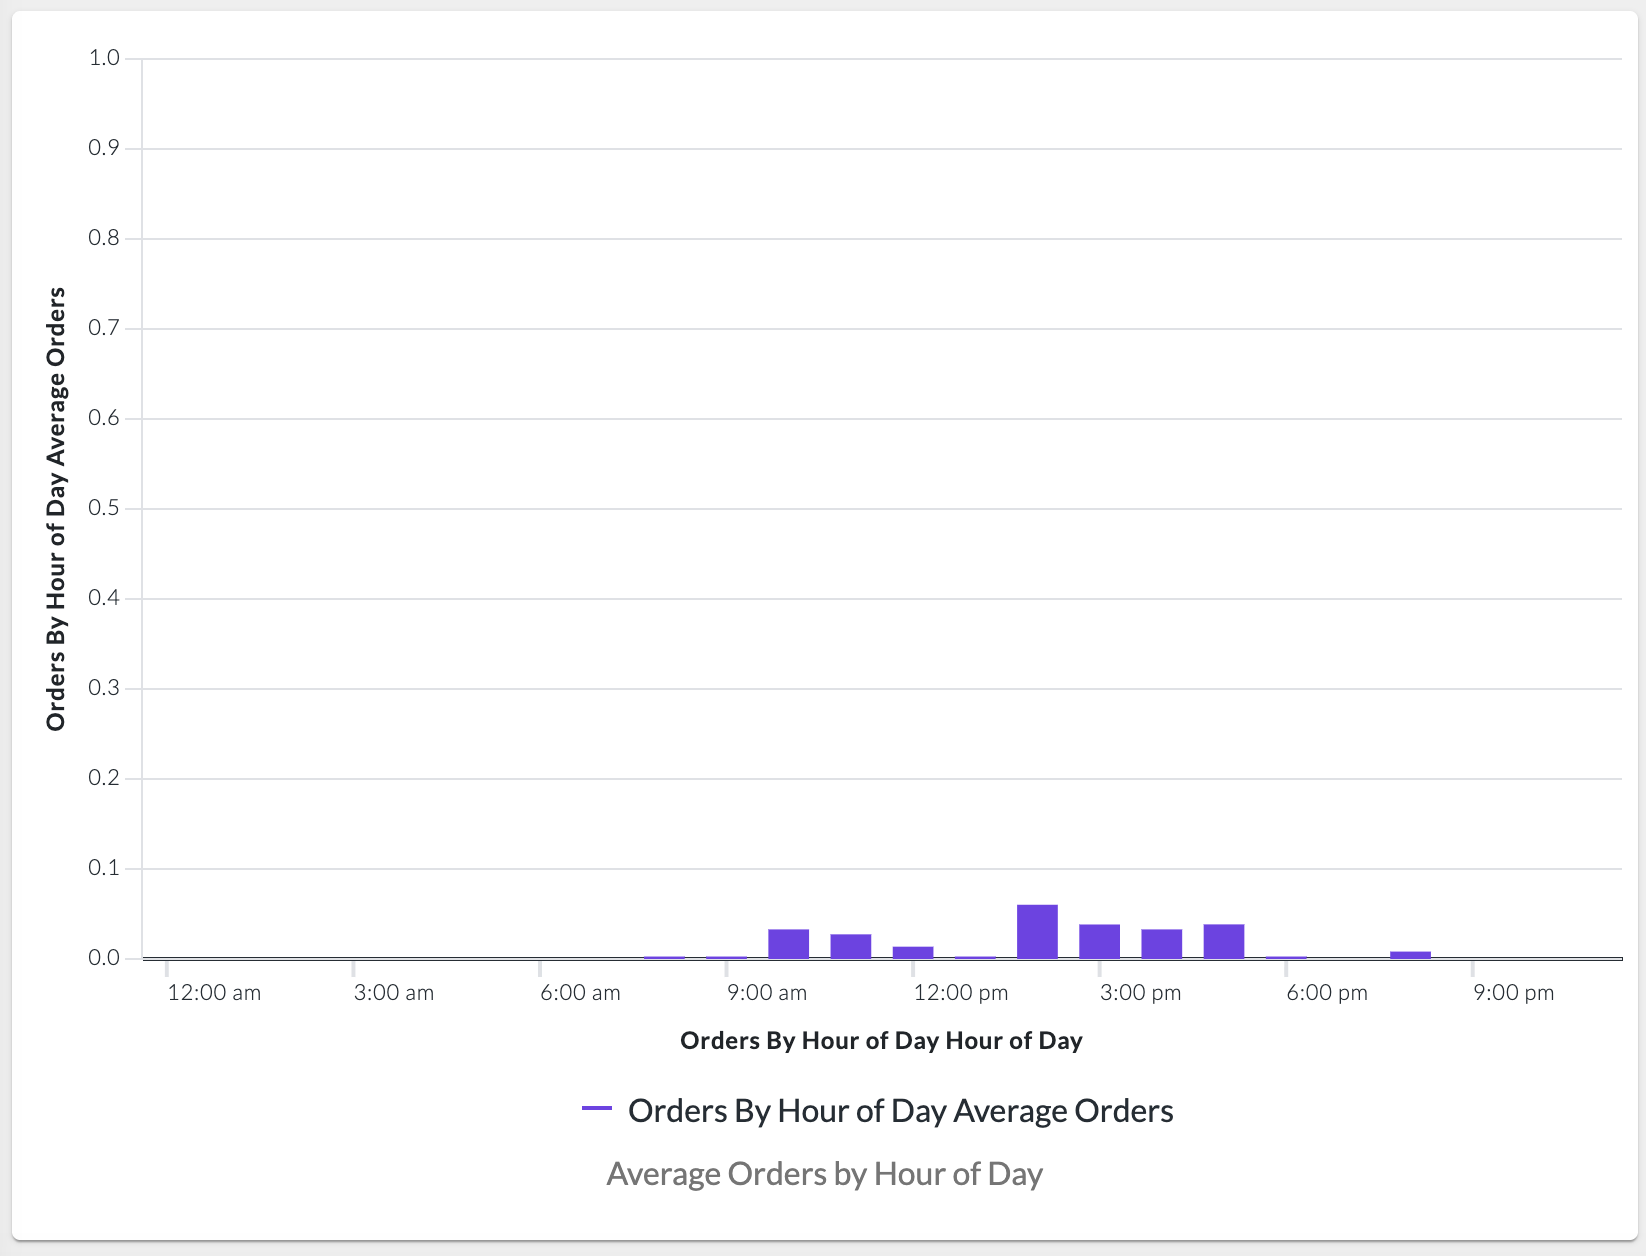
When to use this metric
- Plan customer service staffing levels
- Optimize website maintenance windows
- Schedule marketing campaigns for peak traffic times
- Understand customer behavior patterns
How to interpret
- Good performance: Clear patterns that align with business expectations
- Potential issues: Unexpected peaks may indicate system issues or unusual events
- Benchmark guidance: Patterns vary by market; typical peaks are during lunch and evening hours
Technical details
Domain:orders_by_hour_of_dayFormula: COUNT(orders) grouped by HOUR(order.createdOn) / number_of_days in selected time periodReference Filter Parameters:`orders_by_hour_of_day.created_date`: Filters the metric to orders created within the selected time period`orders_by_hour_of_day.type`: Filters the metric to orders of specific order types (e.g., home delivery, click-and-collect)`retailer.ref`: Filters the metric to orders from the selected retailer