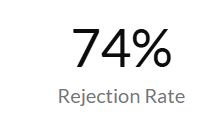
Item Rejection Rate Metric
Essential knowledge
Intended Audience:
Business User
Author:
Movyn John
Changed on:
19 Jan 2026
Overview
Learn about the Item Rejection Rate Metric in Fluent AnalyticsKey points
- High rejection rates directly impact customer satisfaction and delivery times
- May indicate overselling or poor inventory management
- Location-specific patterns can reveal operational inefficiencies
What it measures
Average time from order assignment to fulfillment completion for orders created in the selected time period and are in a complete status.
When to use this metric
- Identify fulfillment locations with operational issues
- Monitor inventory accuracy problems
- Assess the impact of product availability on customer experience
- Evaluate location performance and capacity management
How to interpret
- Good performance: A lower rejection rate indicates healthy operations
- Potential issues: Higher rates suggest inventory inaccuracy or capacity problems
- Benchmark guidance: Monitor trends rather than absolute numbers; sudden spikes need investigation
Technical details
Domain:`fulfilment`Formula: (SUM(fulfillment.items.rejectedQuantity where fulfilment.status not in {EXCLUDED_STATUSES} / SUM(fulfillment.items.requestedQuantity where fulfilment.status not in {EXCLUDED_STATUSES})) * 100
within the selected time period Reference Filter Parameters:
`fulfilment.created_date`: Filters the metric to fulfillments created within the selected time period`fulfilment.status`: {EXCLUDED_STATUSES} - Status definitions for fulfilments not to include (DEFAULT:`-CANCELLED,-CREATED,-SCHEDULED,-PROCESSING,-"AWAITING_WAVE",-ASSIGNED`)`from_location.ref`: Filters the metric to fulfillments assigned to the selected location`retailer.ref`: Filters the metric to fulfillments from the selected retailer
