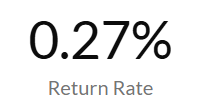
Return Rate Metric
Essential knowledge
Intended Audience:
Business User
Author:
Holger Lierse
Changed on:
19 Jan 2026
Overview
Learn about the Return Rate Metric in Fluent AnalyticsKey points
- Return rates directly impact customer satisfaction and profitability
- Product categories and sales channels have different expected rates
- Seasonal variations are normal, especially after gift-giving periods
What it measures
Percentage of return order item quantities against the customer order item quantities for return order created within the selected time period.
When to use this metric
- Monitor customer satisfaction and product quality trends
- Compare return rates across products, channels, or time periods
- Assess the effectiveness of product descriptions and quality control
- Benchmark performance against industry standards
How to interpret
- Good performance: Return rates below industry averages and stable over time
- Potential issues: Increasing return rates may indicate product or service problems
- Benchmark guidance: Varies by industry
Technical details
Domain:`order_item_return_rate`Formula: (SUM(return.items.qty) where status = {STATUS_COMPLETE} / SUM(order.fulfillments.items.filledQuantity)) within the selected time periodReference Filter Parameters:`order_item_return_rate.created_date`: Filters the metric to return orders created within the selected time period`order_item_return_rate.status_filter`: {STATUS_COMPLETE} - Status definitions for complete returns (default: COMPLETE)`order_item_return_rate.type`: Filters the metric to return orders of specific order types`retailer.ref`: Filters the metric to return orders from the selected retailer

