Cancellation Rate Metric
Essential knowledge
Intended Audience:
Business User
Author:
Movyn John
Changed on:
19 Jan 2026
Overview
Learn about the Cancellation Rate Metric in Fluent AnalyticsKey points
- Customer-initiated cancellations may indicate product or delivery issues
- System-initiated cancellations - may indicate operational problems
- High cancellation rates reduce effective revenue and increase operational cost
What it measures
Percentage of orders that are fully cancelled after being placed in the selected time period.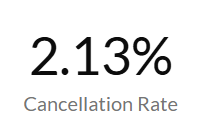
When to use this metric
- Monitor customer satisfaction and order experience
- Identify potential product or pricing issues causing buyer's remorse
- Assess the impact of delivery delays on customer behavior
- Track the effectiveness of order confirmation and communication processes
How to interpret
- Good performance: Cancellation rate below x% indicates smooth operations
- Potential issues: Rates above x% suggest customer experience or operational problems
- Benchmark guidance: Industry averages vary by sector (2-8% is typical for retail)
Technical details
Domain:`orders`Formula:(COUNT(orders) where order.status = {STATUS_CANCELLED} / COUNT(orders)) * 100 within the selected time periodReference Filter Parameters:`order.created_date`: Filters the metric to orders created within the selected time period`order.conditional_status`: {STATUS_CANCELLED} - Status definitions for cancelled orders (default: CANCELLED)`order.type`: Filters the metric to orders of specific order types (e.g., home delivery, click-and-collect)`retailer.ref`: Filters the metric to orders from the selected retailer
`order.status`: Status definitions for all orders