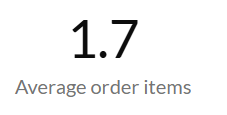
Average Order Items Metric
Essential knowledge
Intended Audience:
Business User
Author:
Movyn John
Changed on:
19 Jan 2026
Overview
Learn about the Average Order Items Metric in Fluent AnalyticsKey points
- Higher items per order generally improve profitability through shared shipping costs
- May be influenced by promotional strategies and seasonal buying patterns
- Bundle deals and sets can artificially inflate this metric
What it measures
Average number of items per order created in the selected time period.
When to use this metric
- Monitor cross-selling and upselling effectiveness
- Assess shopping cart optimization strategies
- Plan picking and packing operations
- Evaluate product bundling and recommendation success
How to interpret
- Good performance: Increasing items per order indicates successful cross-selling
- Potential issues: Declining items per order may suggest poor product recommendations
- Benchmark guidance: Varies significantly by industry; track trends more than absolute values
Technical details
Domain:`order`Formula: SUM(order.items.quantity) / COUNT(orders) within the selected time periodReference Filter Parameters:`order.created_date`: Filters the metric to orders created within the selected time period`order.type`: Filters the metric to orders of specific order types (e.g., home delivery, click-and-collect)`retailer.ref`: Filters the metric to orders from the selected retailer
`order.status`: Filters all orders considered for the formula to only use orders in these statuses`order.conditional_status`: Filters just the count of order items to consider only orders in this status`order_item.status`: Filters order items to only count order item quantity if the item status matches a status in this parameter
