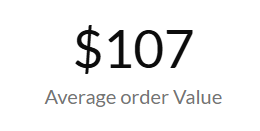
Average Order Value Metric
Essential knowledge
Intended Audience:
Business User
Author:
Movyn John
Changed on:
19 Jan 2026
Overview
Learn about the Average Order Value Metric in Fluent AnalyticsKey points
- Currency differences may affect multi-region comparisons
- Seasonal variations are normal for many retail categories
- Promotions and discounts will temporarily reduce AOV
What it measures
Average financial value per order created in the selected time period which have been completed.
When to use this metric
- Assess pricing strategy effectiveness
- Monitor customer spending behavior changes
- Evaluate the impact of promotions on order value
- Set targets for upselling and cross-selling initiatives
How to interpret
- Good performance: Steady increases or meeting AOV targets
- Potential issues: Declining AOV may indicate price sensitivity or competitive pressure
- Benchmark guidance: Compare to historical trends and industry benchmarks for your category
Technical details
Domain:`order`Formula: SUM(order.totalPrice) / COUNT(orders) for orders where status = {COMPLETE} within the selected time periodReference Filter Parameters:`order.created_date`: Filters the metric to orders created within the selected time period`order.status`: Status definitions for complete orders (default: COMPLETE)`order.type`: Filters the metric to orders of specific order types (e.g., home delivery, click-and-collect)`retailer.ref`: Filters the metric to orders from the selected retailer
`order.conditional_status`: Filters the 'total price' part of the formula to consider only orders in these statuses.
