Top 10 Products Fulfilled Metric
Essential knowledge
Intended Audience:
Business User
Author:
Movyn John
Changed on:
21 May 2026
Overview
Learn about the Top 10 Products Fulfilled Metric in Fluent AnalyticsKey points
- High-volume products require optimized inventory and fulfillment processes
- Seasonal variations are normal for many product categories
- Product mix highlights fulfilment trends
What it measures
Top 10 most frequently fulfilled products by volume for fulfillments created in the selected time period.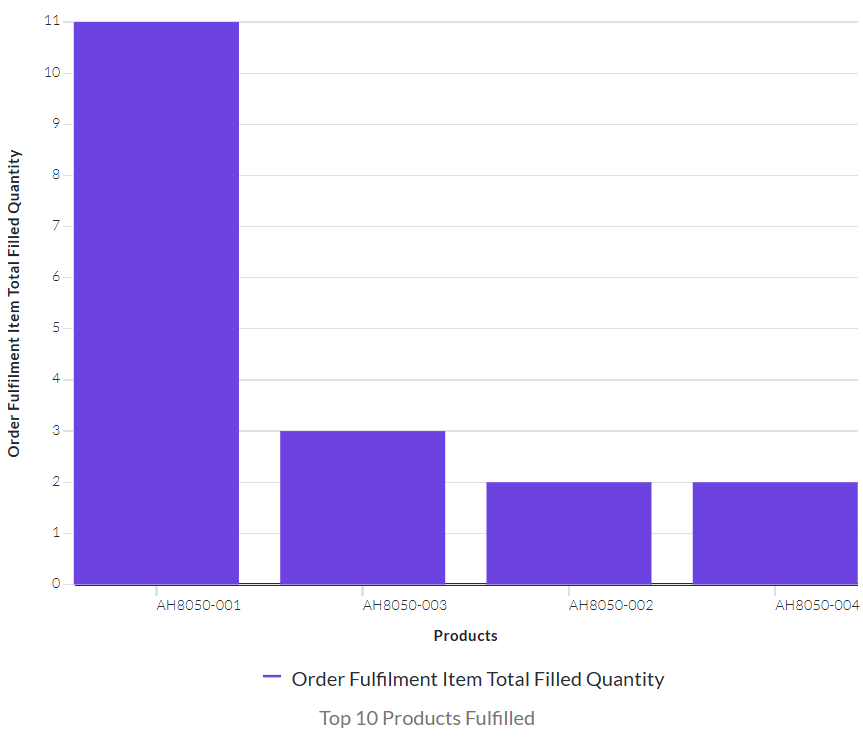
When to use this metric
- Identify high-demand products for inventory planning
- Assess product performance and popularity trends
- Plan warehouse layout and picking optimization
- Evaluate marketing and merchandising effectiveness
How to interpret
- Good performance: Top products align with strategic priorities and margins
- Potential issues: Over-concentration on few products creates inventory risk
- Benchmark guidance: Monitor changes in rankings and volumes over time
Technical details
Domain:`fulfilment`Formula: COUNT(fulfillment.items.product) grouped by product, ordered by count desc, limited to top 10 within the selected time periodReference Filter Parameters:`from_location.ref`: Filters the metric to fulfillments assigned to the selected location`fulfilment.created_date`: Filters the metric to fulfillments created within the selected time period`retailer.ref`: Filters the metric to fulfillments from the selected retailer