Top 10 Purchased Products Metric
Essential knowledge
Intended Audience:
Business User
Author:
Movyn John
Changed on:
16 Jan 2026
Overview
Learn about the Top 10 Purchased Products Metric in Fluent AnalyticsKey points
- Purchase frequency differs from sales volume (many small vs. few large orders)
- Frequently purchased items often drive customer loyalty
- May indicate essential or consumable product characteristics
What it measures
Top 10 products with the highest volume of fulfilled inventory within the time period.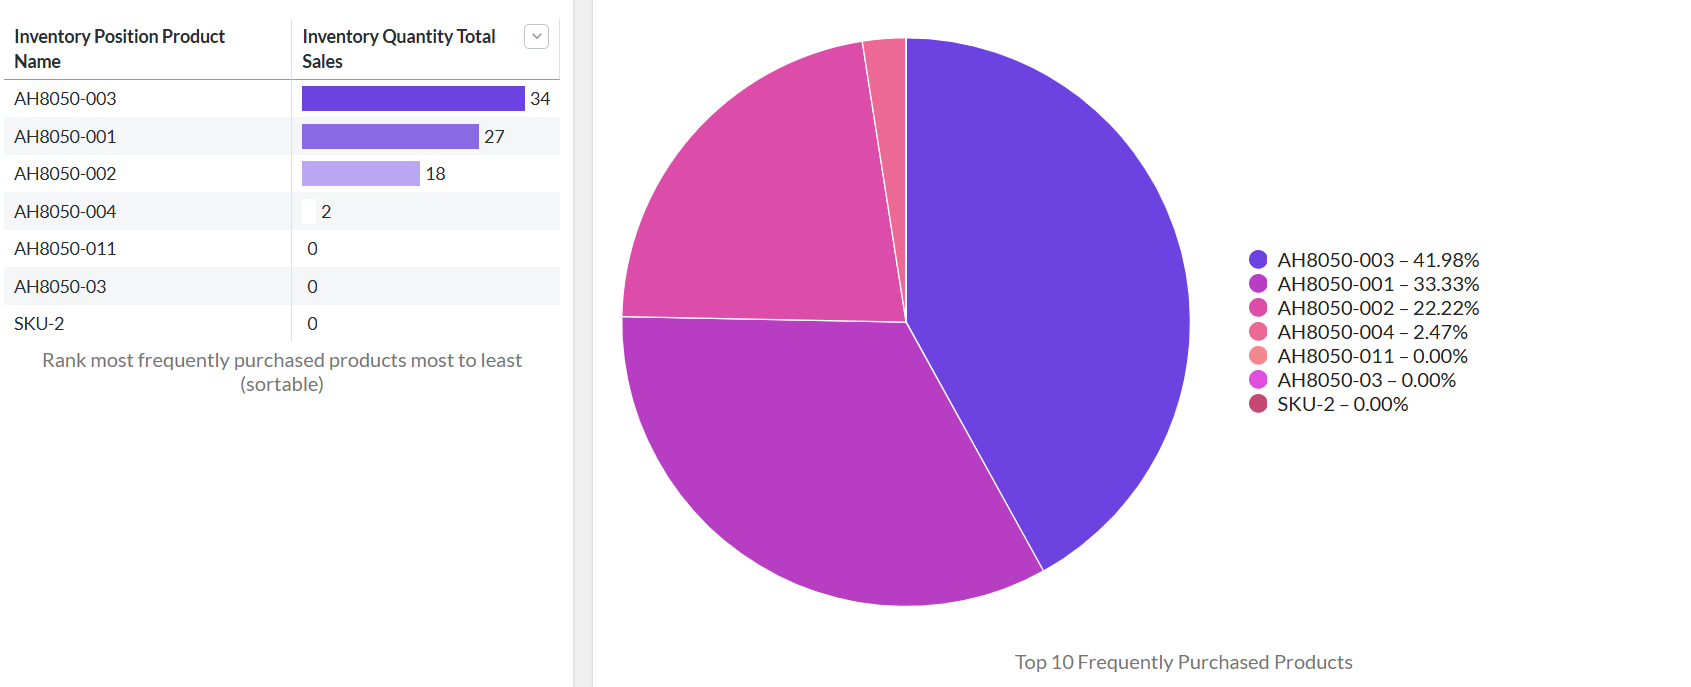
When to use this metric
- Identify customer favorites and core products
- Guide merchandising and promotional strategies
- Optimize product placement and availability
- Assess customer satisfaction with product offerings
How to interpret
- Good performance: Frequently purchased items align with strategic priorities
- Potential issues: Over-reliance on few products creates business risk
- Benchmark guidance: Monitor changes in purchase frequency patterns
Technical details
Domain:`inventory_quantity`Formula: SUM(inventoryQuantity.qty) where type = {TYPE_SALE} grouped by product, ordered by SUM DESC, limited to top 10
within the selected time periodReference Filter Parameters:
`inventory_quantity.type`: TYPE_SALE: Type definitions for inventory quantity sales (default: SALE)`inventory_quantity.created_date`: Filters the metric to inventory quantities in the selected date range`inventory_catalogue.ref`: Filters the metric to inventory quantities for the selected catalogue`location.ref`: Filters the metric to inventory quantities for the selected location`retailer.ref`: Filters the metric to inventory quantities from the selected retailer