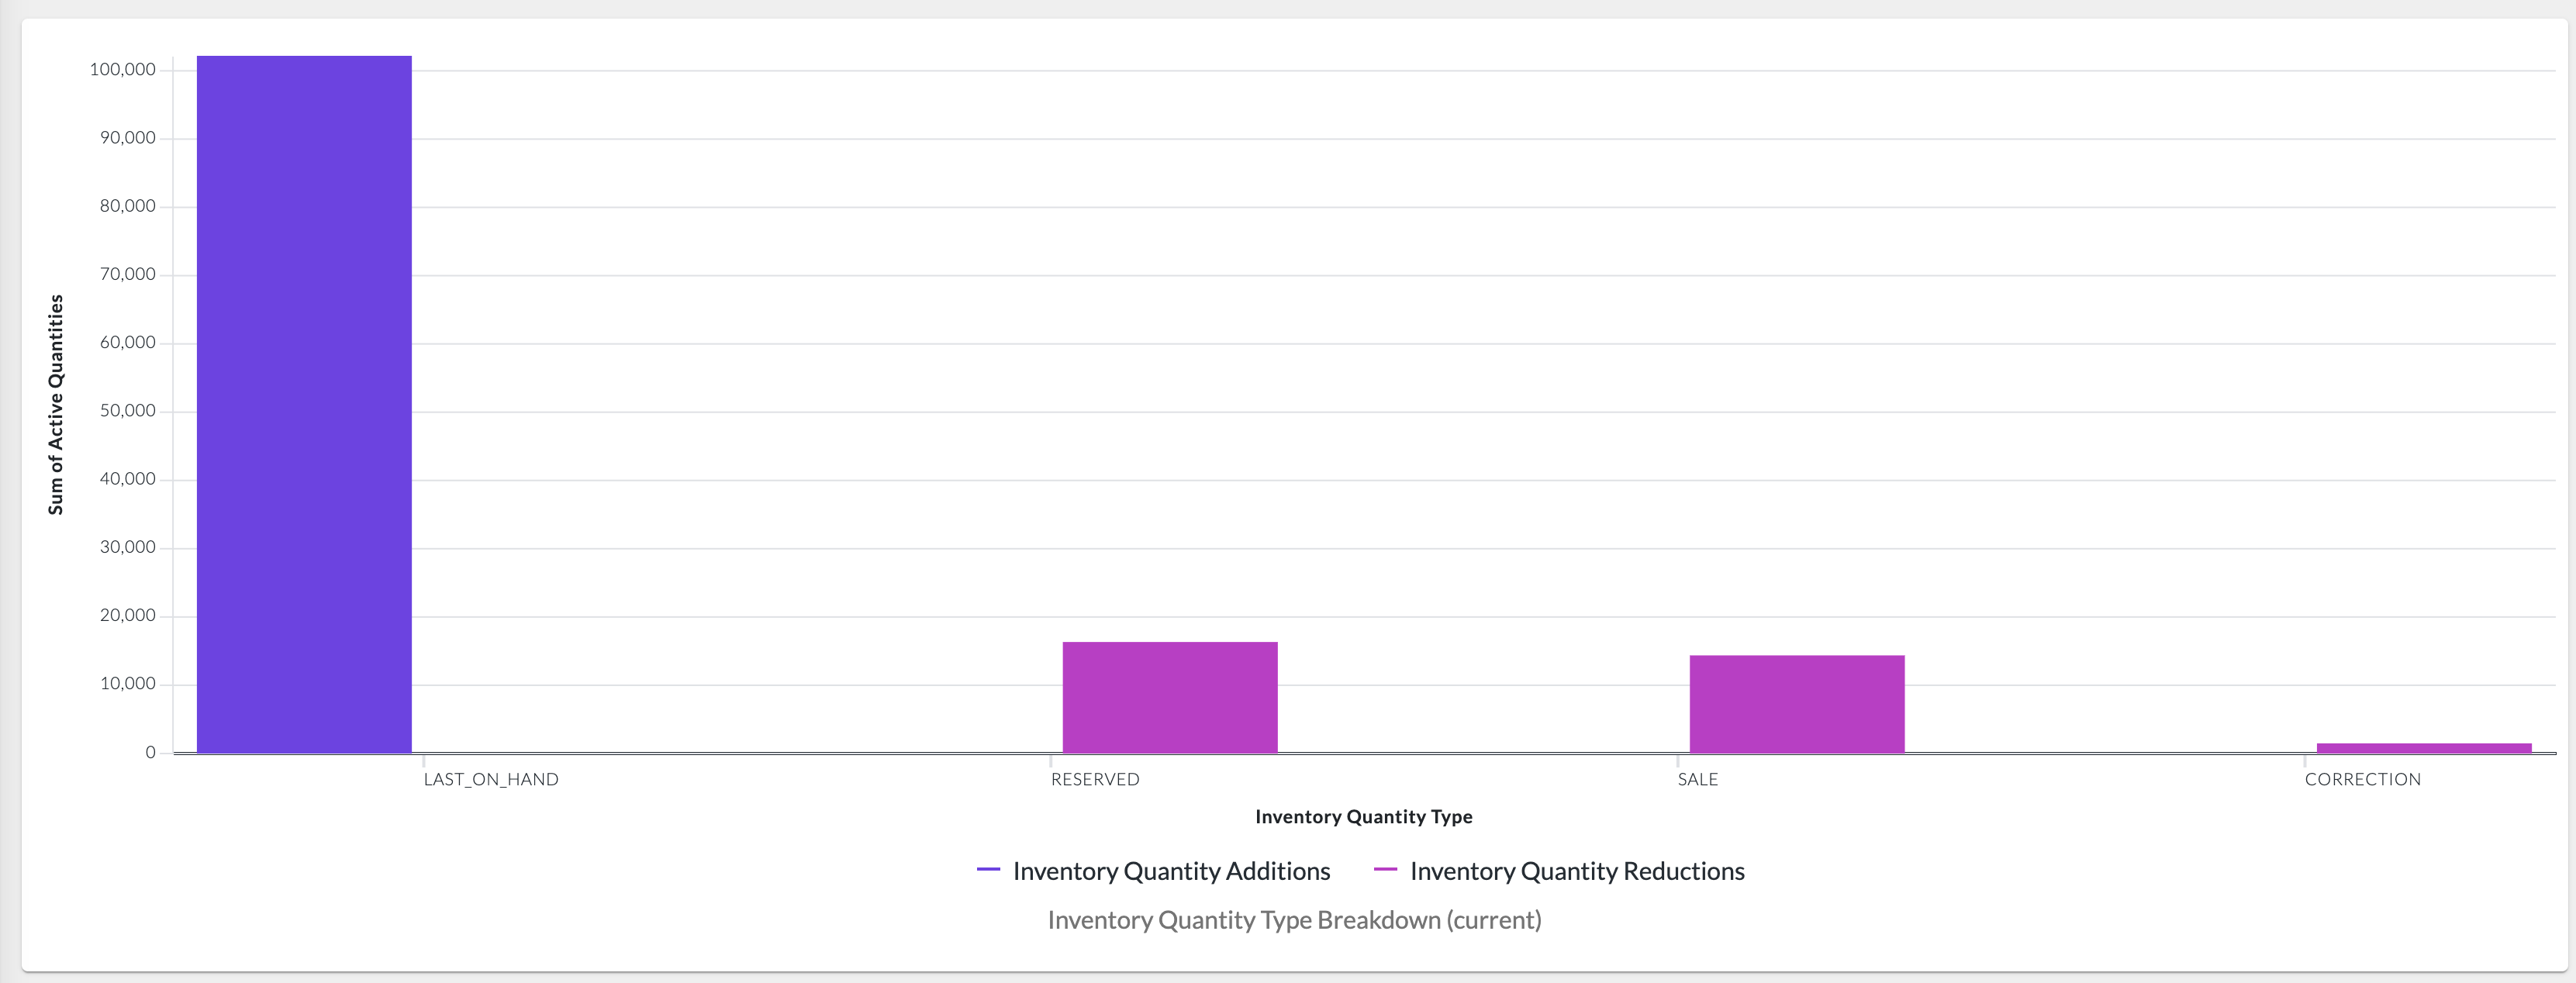
Inventory Quantity Type Breakdown Metric
Essential knowledge
Intended Audience:
Business User
Author:
Movyn John
Changed on:
16 Jan 2026
Overview
Learn about the Inventory Quantity Type Breakdown Metric in Fluent AnalyticsKey points
- Different transaction types reflect different inventory activities (sales reduce inventory, returns increase it, corrections adjust it)
- Type distribution changes over time based on business cycles and operational efficiency
- High correction volumes may indicate inventory accuracy issues
- Reserved quantities show demand pipeline but aren't yet fulfilled
What it measures
Breakdown of the current total on-hand inventory by inventory quantity transaction types (sale, reserved, correction, returned, etc.).
When to use this metric
- Understand inventory movement patterns and transaction composition
- Analyze the balance between different inventory transaction types
- Track how inventory is being consumed, reserved, adjusted, or returned
- Monitor operational patterns in inventory management
How to interpret
- Good performance: Transaction type distribution aligns with business operations and expectations
- Potential issues: Unexpectedly high correction or returned types may indicate operational problems
- Benchmark guidance: Distribution patterns vary by business model; focus on trends rather than absolute percentages
- Time-Range Independent: This metric does not take into account the time range. It instead only counts currently active inventory quantities.
Technical details
Domain:`inventory_position`Formula: SUM(inventoryQuantity.qty where inventoryQuantity.status = {STATUS_ACTIVE}) grouped by inventoryQuantity.type as of current timestampReference Filter Parameters:
`inventory_catalogue.ref`: Filters the metric to inventory positions for the selected inventory catalogue`inventory_position.product_ref`: Filters the metric to inventory positions for the selected product`inventory_quantity.status`: {STATUS_ACTIVE} - Status definitions for inventory quantities (default: ACTIVE)`location.ref`: Filters the metric to inventory positions for the selected location`retailer.ref`: Filters the metric to inventory positions from the selected retailer
