Top 10 Short Picked Products Metric
Essential knowledge
Intended Audience:
Business User
Author:
Movyn John
Changed on:
16 Jan 2026
Overview
Learn about the Top 10 Short Picked Products Metric in Fluent AnalyticsKey points
- Short picks directly impact customer satisfaction
- May indicate demand forecasting errors or supply chain issues
- Product-specific patterns can guide targeted improvements
What it measures
Top 10 products with the highest volume of corrected inventory within the time period.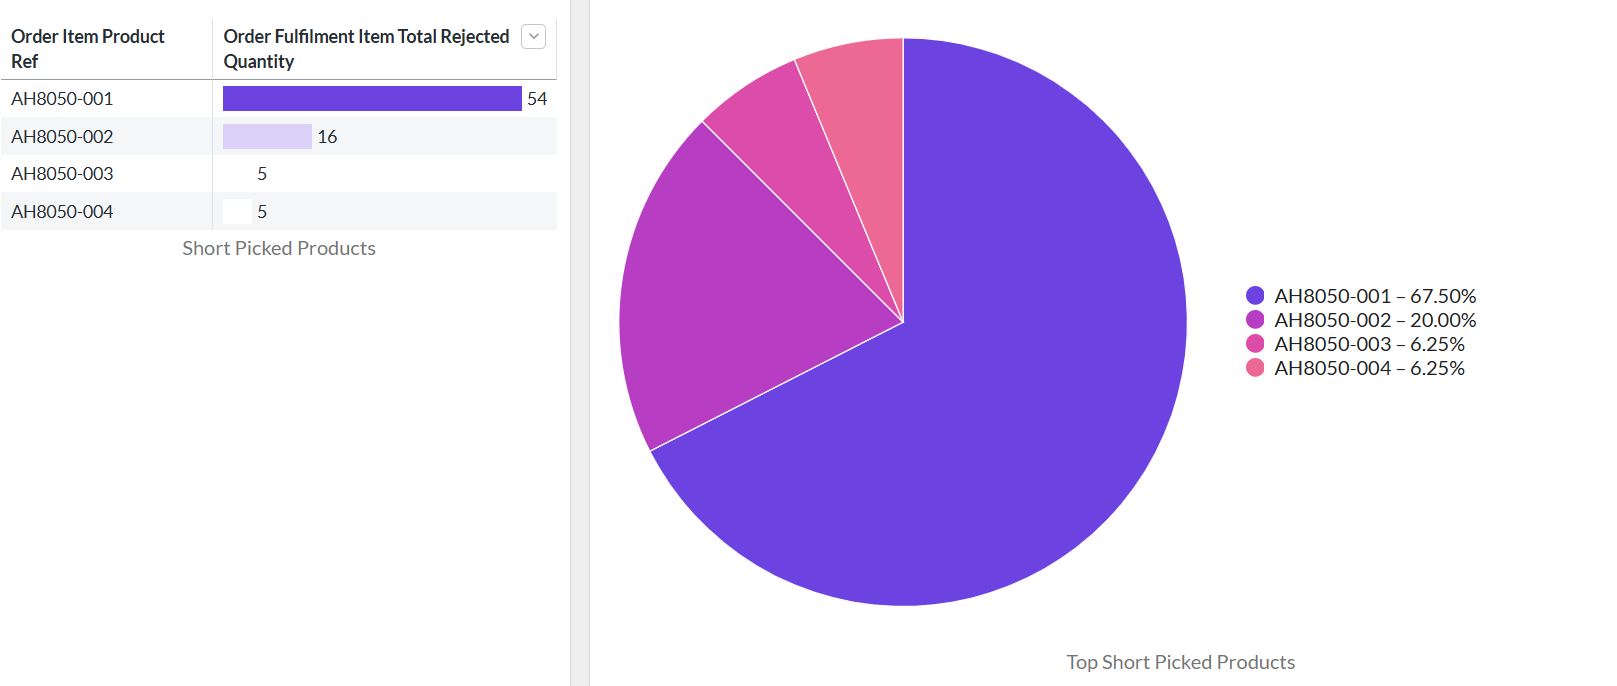
When to use this metric
- Identify products with chronic availability issues
- Guide inventory planning and safety stock decisions
- Assess demand forecasting accuracy for specific products
- Prioritize inventory management improvement efforts
How to interpret
- Good performance: Short-pick patterns are predictable and manageable
- Potential issues: Frequent short-picks indicate inventory planning problems
- Benchmark guidance: Should trend toward zero for strategic products
Technical details
Domain:`inventory_quantity`Formula: SUM(inventoryQuantity.qty) where type = {TYPE_CORRECTION} grouped by product,
ordered by SUM DESC,
limited to top 10
within the selected time periodReference Filter Parameters:
`inventory_quantity.type`: TYPE_CORRECTION: Type definitions for inventory quantity sales (default: CORRECTION)`inventory_quantity.created_date`: Filters the metric to inventory quantities created in the selected date range`inventory_catalogue.ref`: Filters the metric to inventory quantities belonging to the selected inventory catalogue`location.ref`: Filters the metric to inventory quantities for the selected location`retailer.ref`: Filters the metric to inventory quantities from the selected retailer