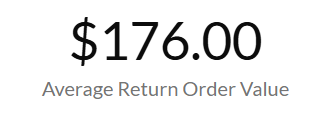
Average Return Order Value Metric
Essential knowledge
Intended Audience:
Business User
Author:
Holger Lierse
Changed on:
19 Jan 2026
Overview
Learn about the Average Return Order Value Metric in Fluent AnalyticsKey points
- High-value returns have disproportionate financial impact
- Return processing costs are often fixed regardless of value
- Customer service recovery is critical for high-value returns
- Currency symbols may not be meaningful when viewing multiple retailers in different countries
- Only includes completed return orders
- Revenue timing is based on return order completion, not refund processing
What it measures
Average financial value per return order created in the selected time period which have been completed.
When to use this metric
- Monitor the financial impact of returns on revenue
- Assess return patterns by order value segments
- Evaluate the effectiveness of return policies
- Guide return prevention strategies
How to interpret
- Good performance: Return values are low relative to average order values
- Potential issues: High return values may indicate quality or expectation issues
- Benchmark guidance: Should be significantly lower than average order value
Technical details
Domain:`return_order`Formula: SUM(returnOrder.totalAmount) / COUNT(returnOrders) where status = {STATUS_COMPLETE} within the selected time periodReference Filter Parameters:
`retailer.ref`: Filters the metric to return orders from the selected retailer`return_order.created_date`: Filters the metric to return orders created within the selected time period`return_order.status`: {STATUS_COMPLETE} - Status definitions for complete returns (default: COMPLETE)`return_order.type`: Filters the metric to return orders of specific order types

