Metrics Overview
Essential knowledge
Author:
Kirill Gaiduk
Changed on:
22 Aug 2024
Overview
This document is intended to introduce the Metrics and describe their place within the Fluent Big Inventory product.Pre-requisites:- You should have knowledge of the Inventory.
- You should have knowledge of OMX Workflow Framework.
- You should have knowledge of Events.
- You should have knowledge of GraphQL.
Key points
- Metrics are available for all Fluent Order Management and Fluent Big Inventory customers.
- Metrics data is captured, uploaded, and stored in a monitoring system.
- Metrics data is retrieved via the Metrics API.
- Metrics data can be visualized with the OMX UX Framework, Business intelligence tools, and third-party Metrics analytics platforms.
What are Metrics for?
Metrics data visualization provides visibility of Fluent platform operational data and allows to monitor and observe platform/inventory availability and orchestration insights.Value Proposition
Metrics enablement brings the necessary tools to:- Improve the visibility and insights of the Fluent platform.
- Identify potential problems or anomalies in the Fluent platform before an escalation into critical issues.
- Provides an aggregate view of the internal state of the platform, allows the detection of problems quickly, reduces the time spent diagnosing issues, and speeds up the resolution process.
Functional Model
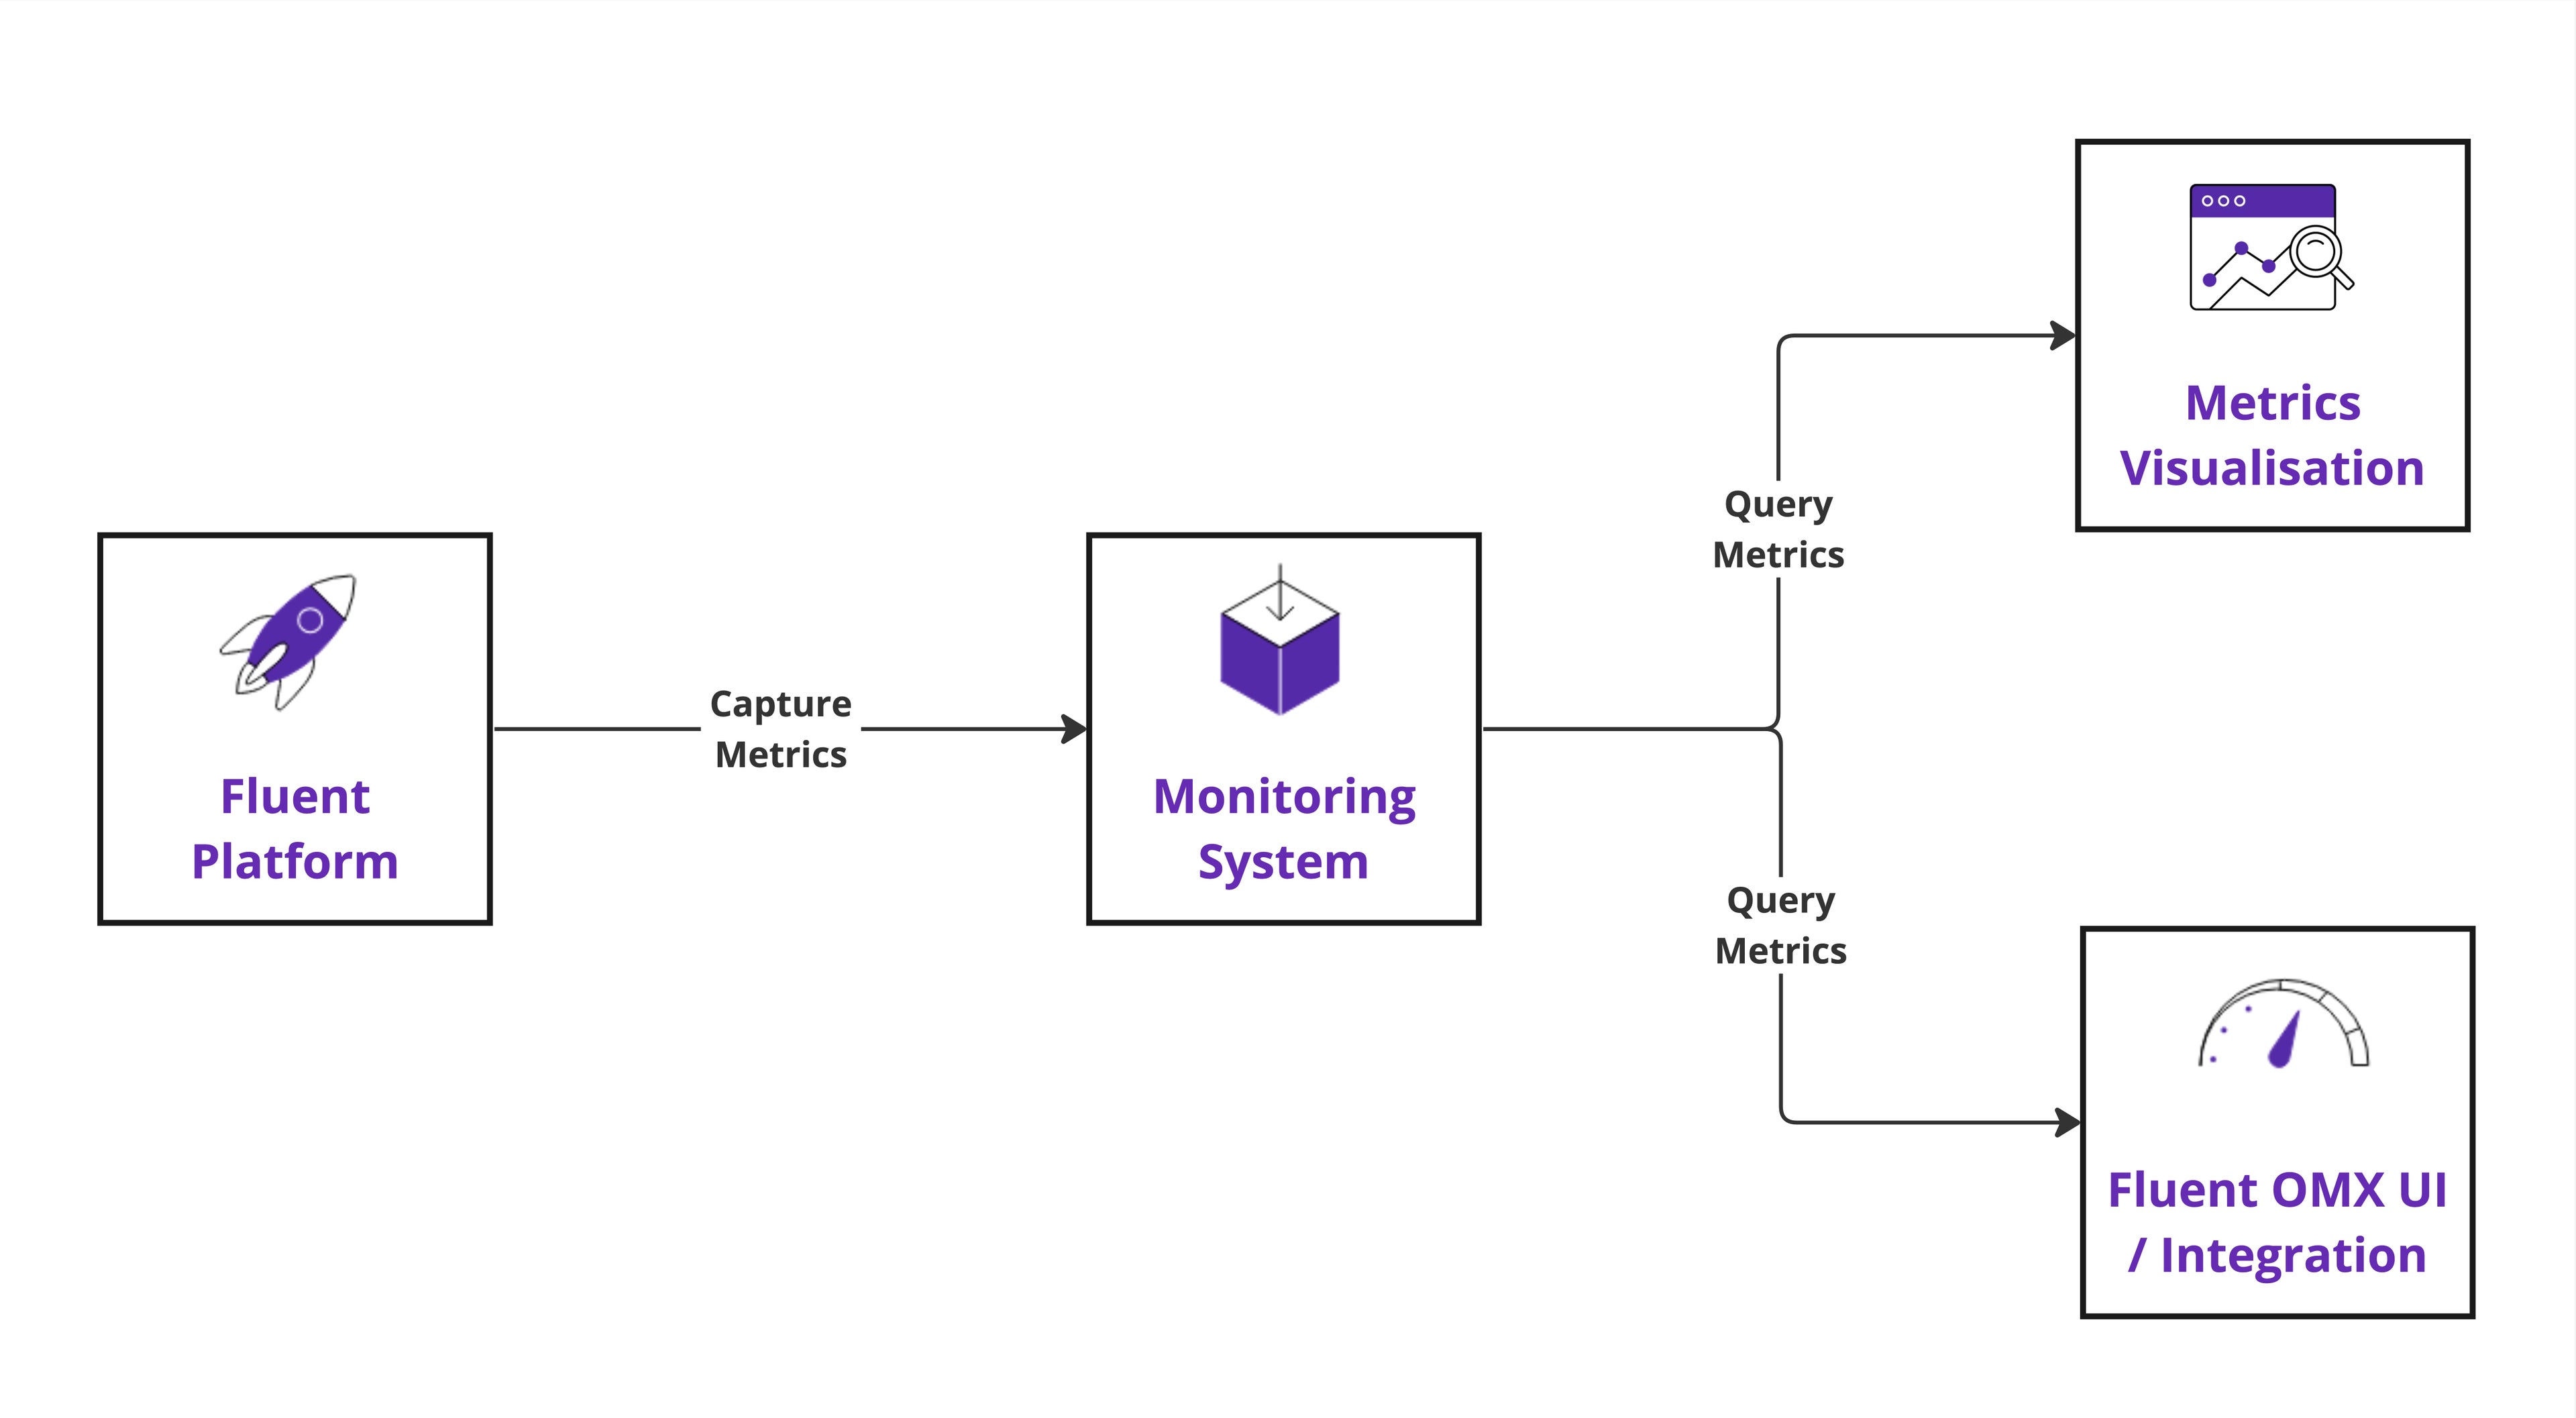
There are two main stages to achieve the objective of improving the visibility/insights of the Fluent Platform:- Metrics capturing
- Metrics querying
Features
Metrics enable the following functionality:Capturing, uploading, and storing Metrics Data
While the Fluent platform and applications process customers' requests, the instrumentation is integral to the Fluent application source code to enhance processing visibility and capture the Metrics. The Fluent Platform source code is instrumented to collect Metrics and upload those Metrics data into the Metrics workspace. The Metrics workspace is then queried to retrieve the Metrics data.Querying Metrics Data
The Metrics monitoring system provides a dimensional data model and flexible query language to select the Metrics data and aggregate the time series data in real-time. See the Query Syntax section described in the Getting Started with Metrics API article for query details.Visualizing Metrics Data
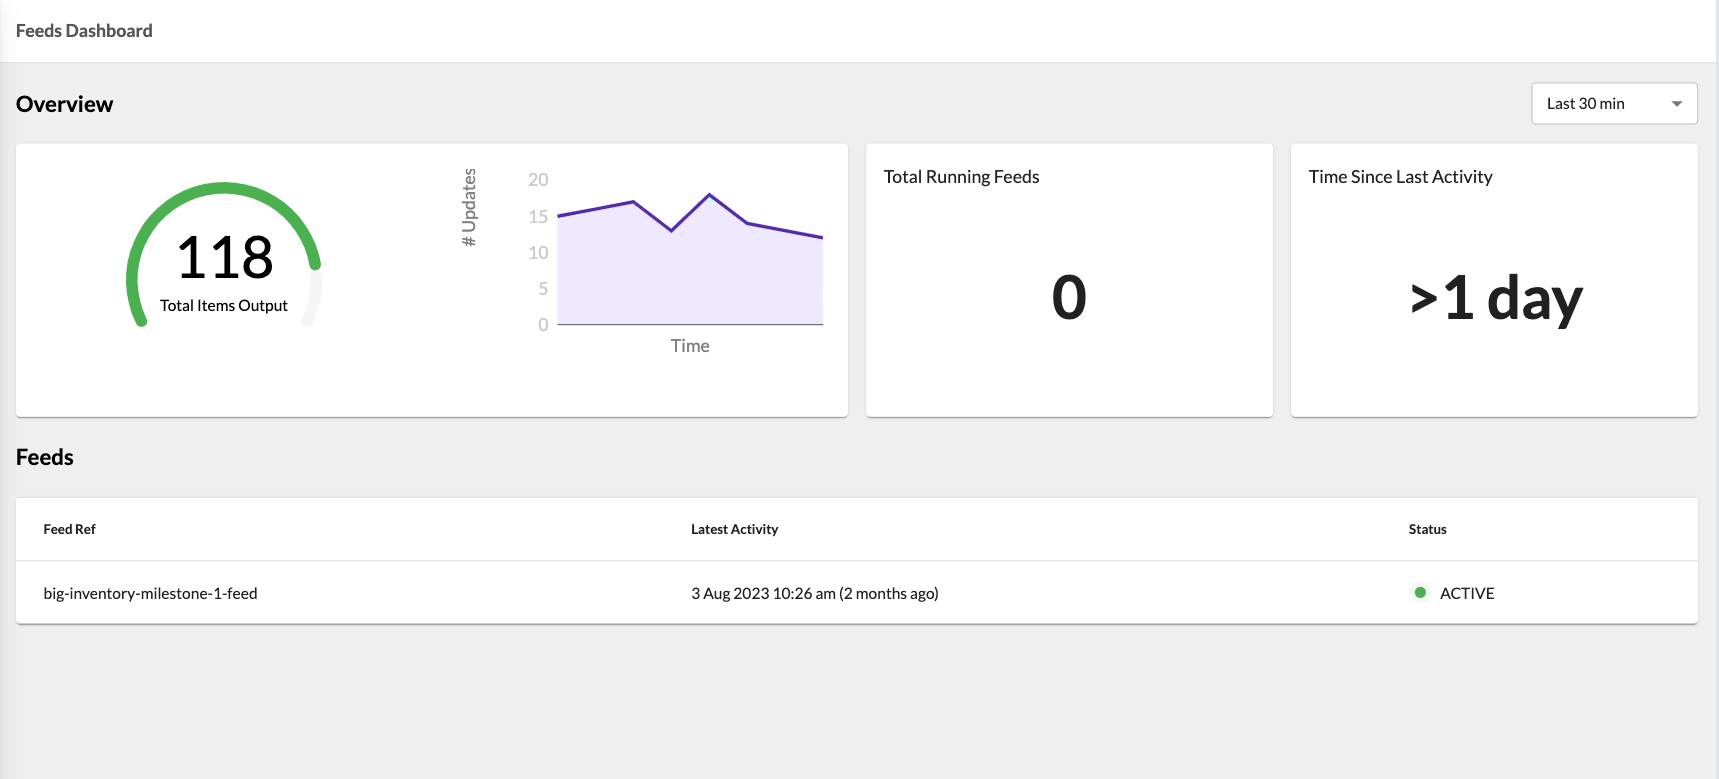
Metrics API query operations provide the necessary Metrics data to display the charts, diagrams, and dashboards.Customer Metrics data could be visualized by hooking up the Metrics query data with:1. OMX UX Framework, for example: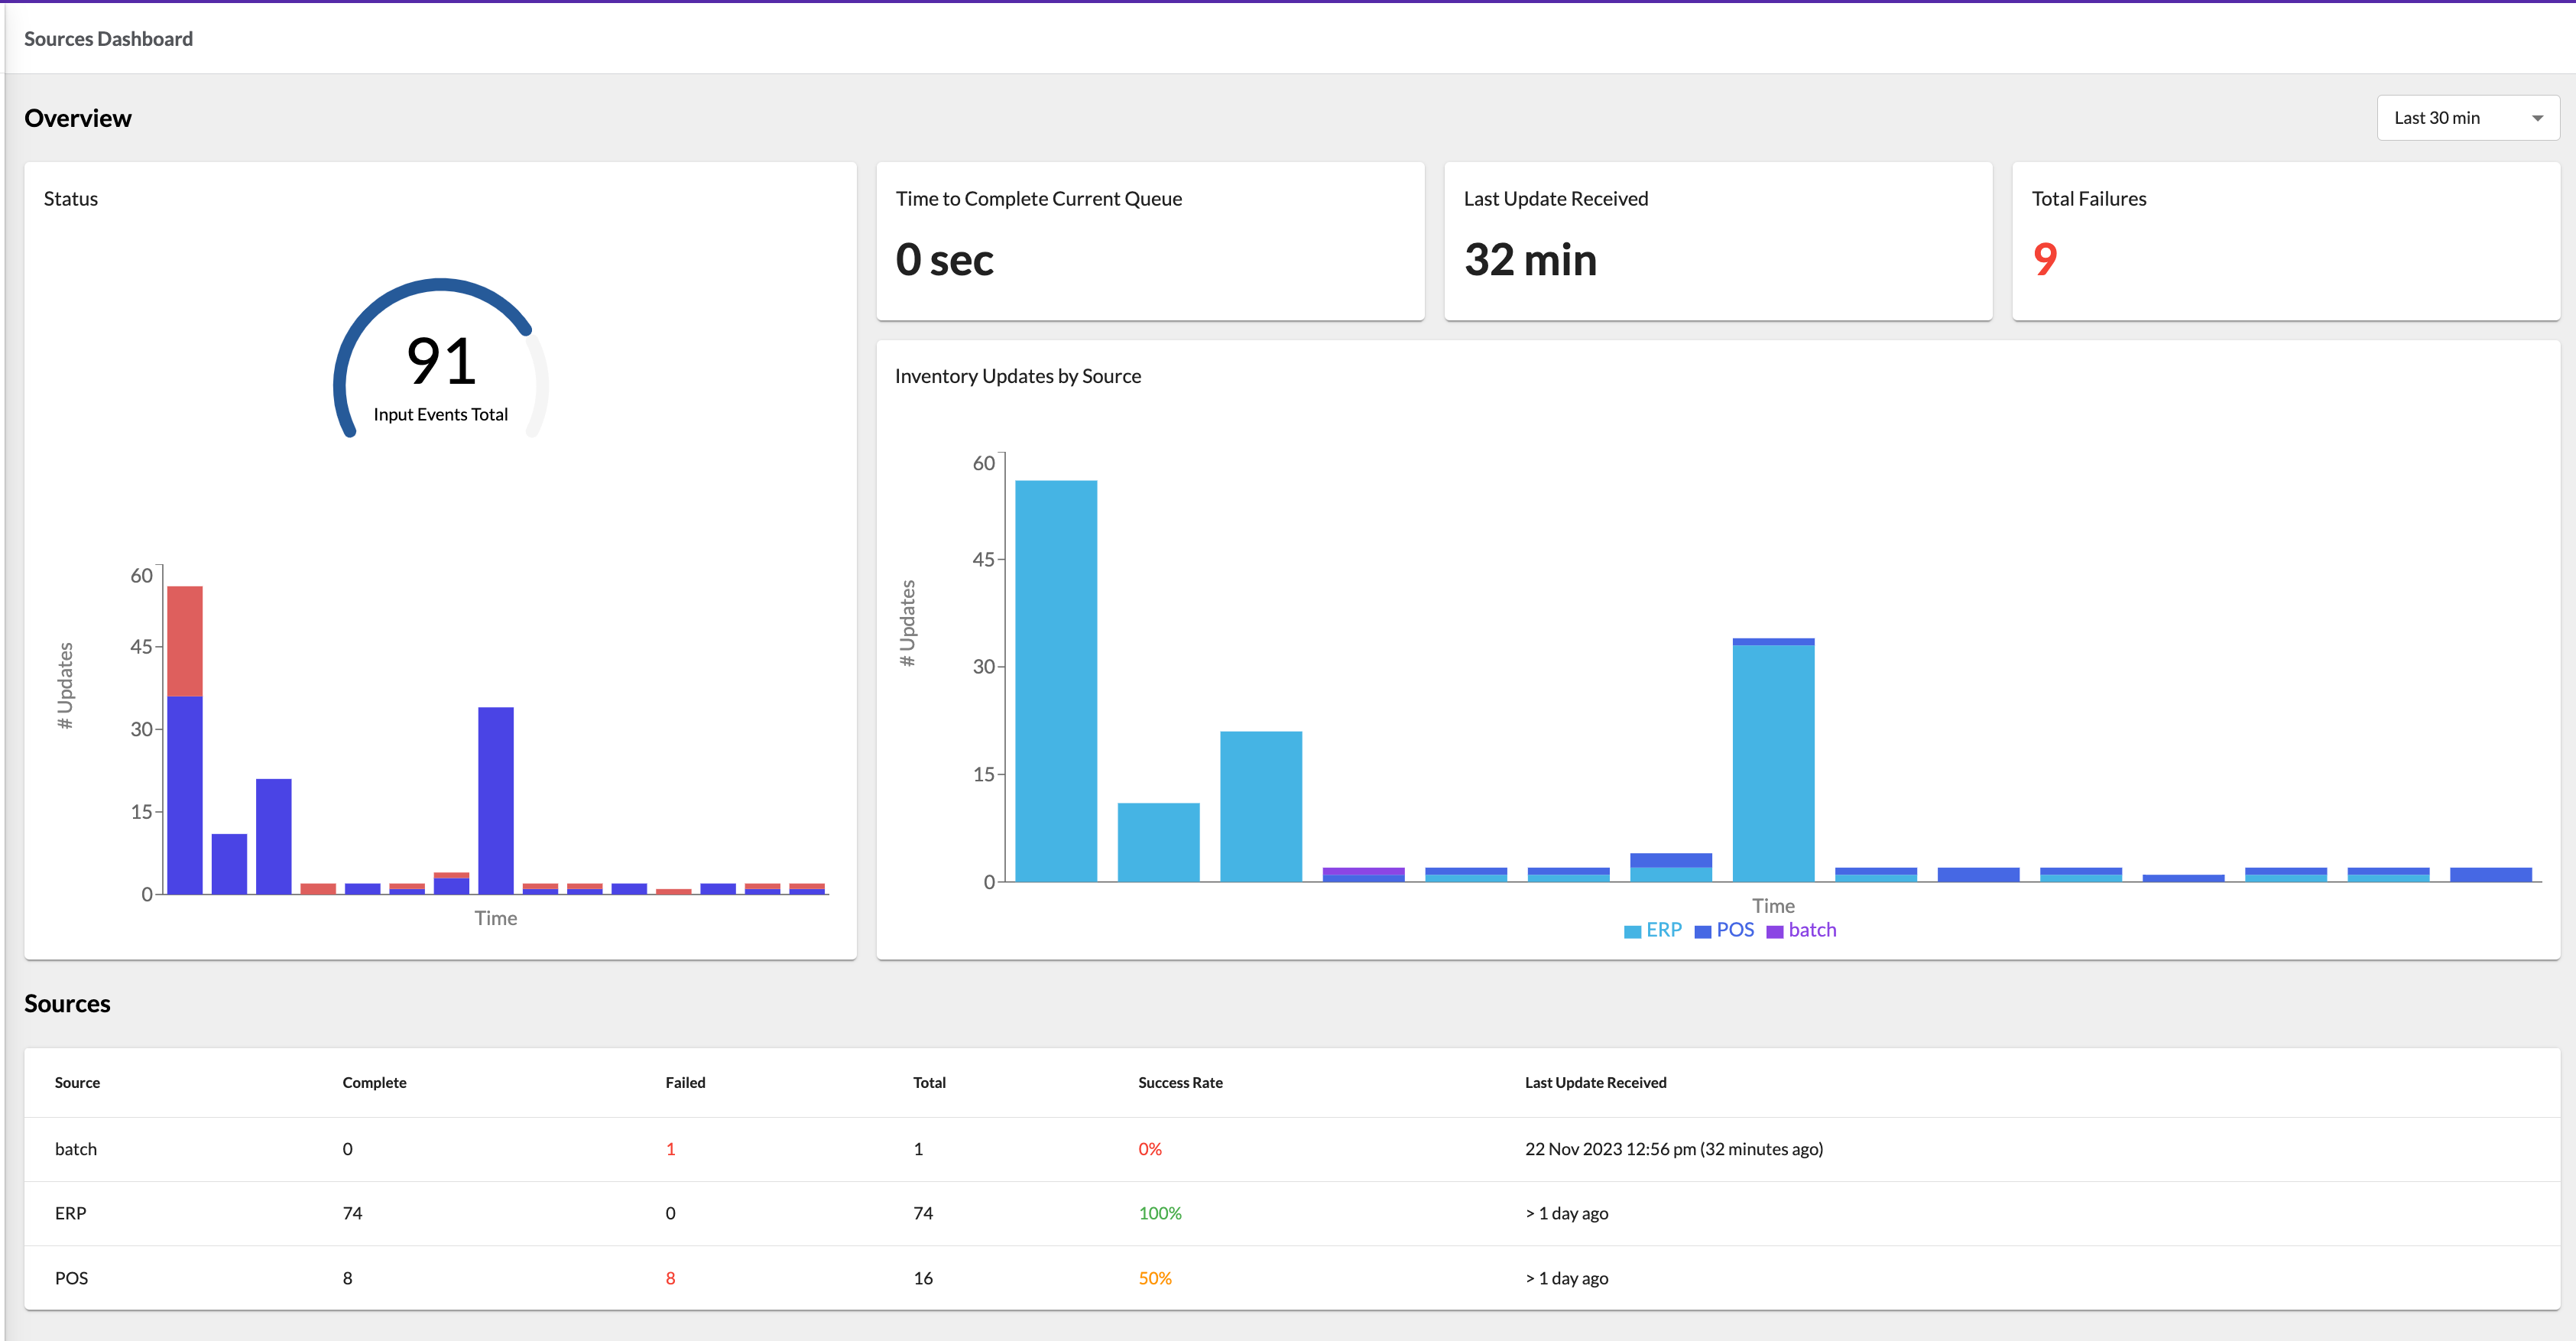
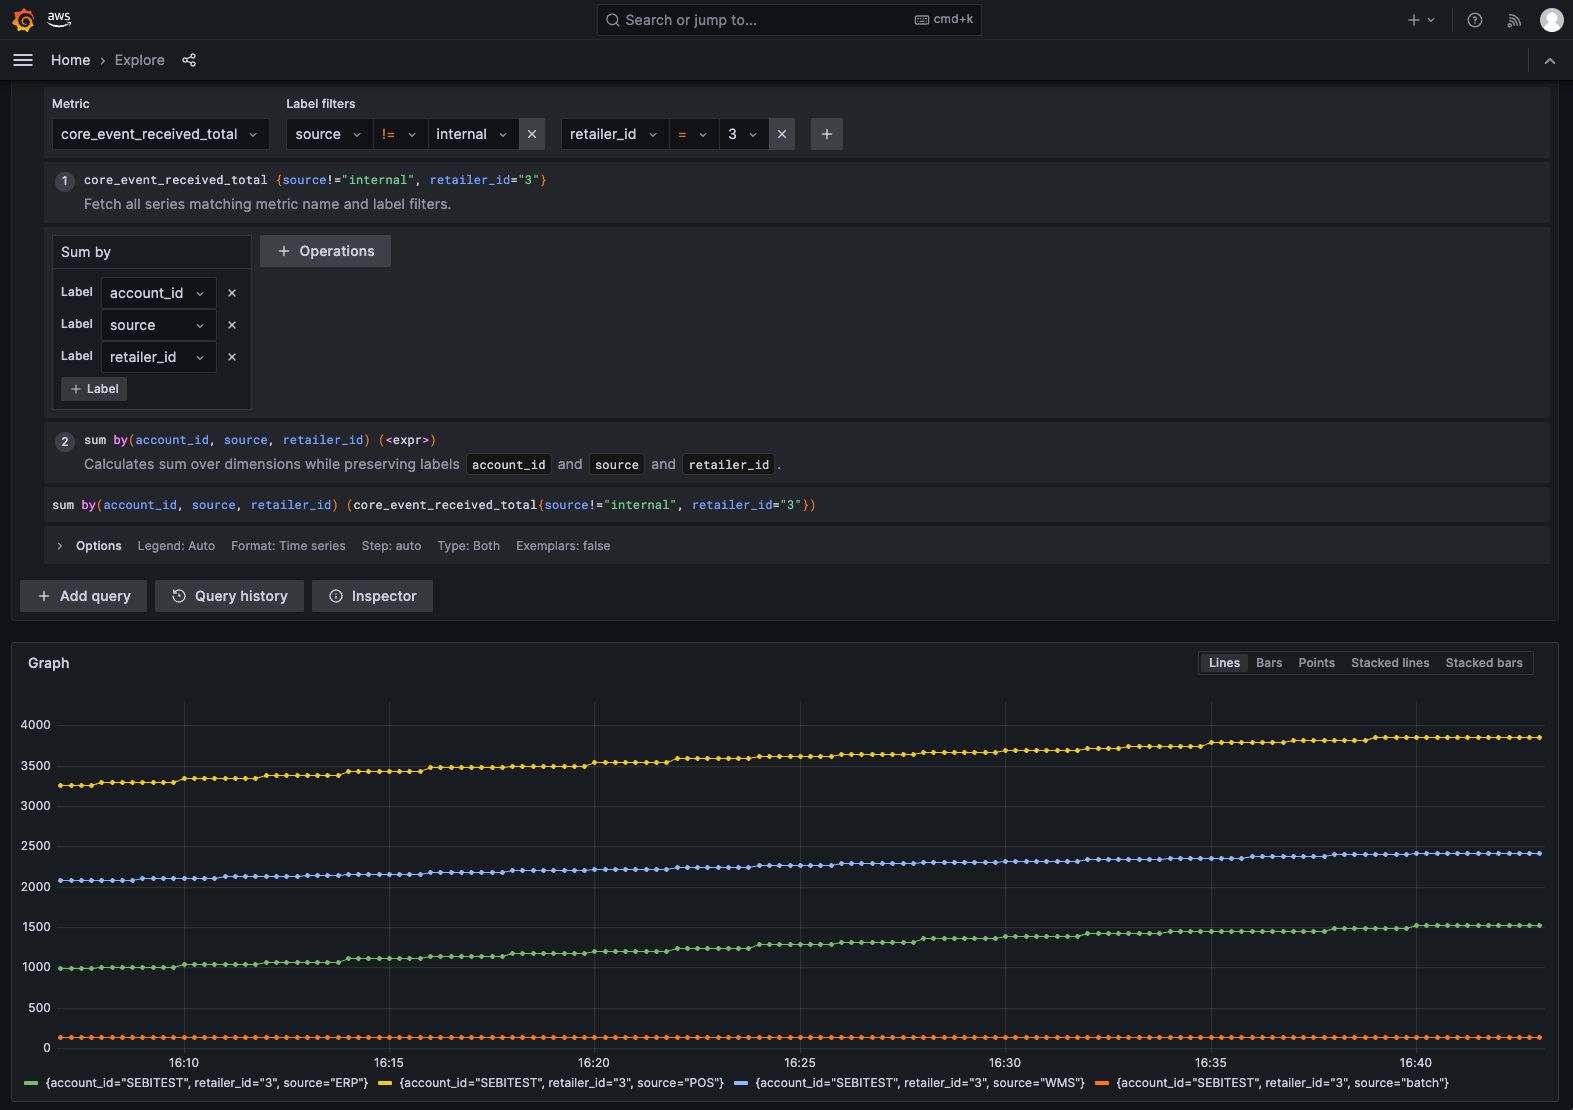
 2. Metrics analytics and visualisation platforms. For example: