Sources Interface
Essential knowledge
Intended Audience:
Business User
Author:
Fluent Commerce
Changed on:
28 July 2026
Overview
The Sources interface provides inventory and batch-processing metrics visibility, enabling data ingestion and processing efficiency tracking. It includes:- Sources Dashboard – Monitors inventory updates, failure rates, and processing times.
- BPP Metrics Dashboard – Tracks batch-processing efficiency, showing processed, changed, and unchanged records with a date range filter of up to 31 days.
Key points
- Sources Dashboard provides real-time tracking of failed updates, update frequency, total received updates, and estimated processing times.
- BPP Metrics Dashboard enhances visibility into batch data ingestion by tracking record modifications.
Sources Dashboard
Overview
The Sources Dashboard allows inventory ingestion status and processing flow to be monitored. It provides real-time data visualization, helping identify failures, track update frequencies, and assess inventory submission performance.The dashboard presents inventory-related metrics for up to the last 24 hours. Configurable time periods allow detailed analysis based on ingestion trends.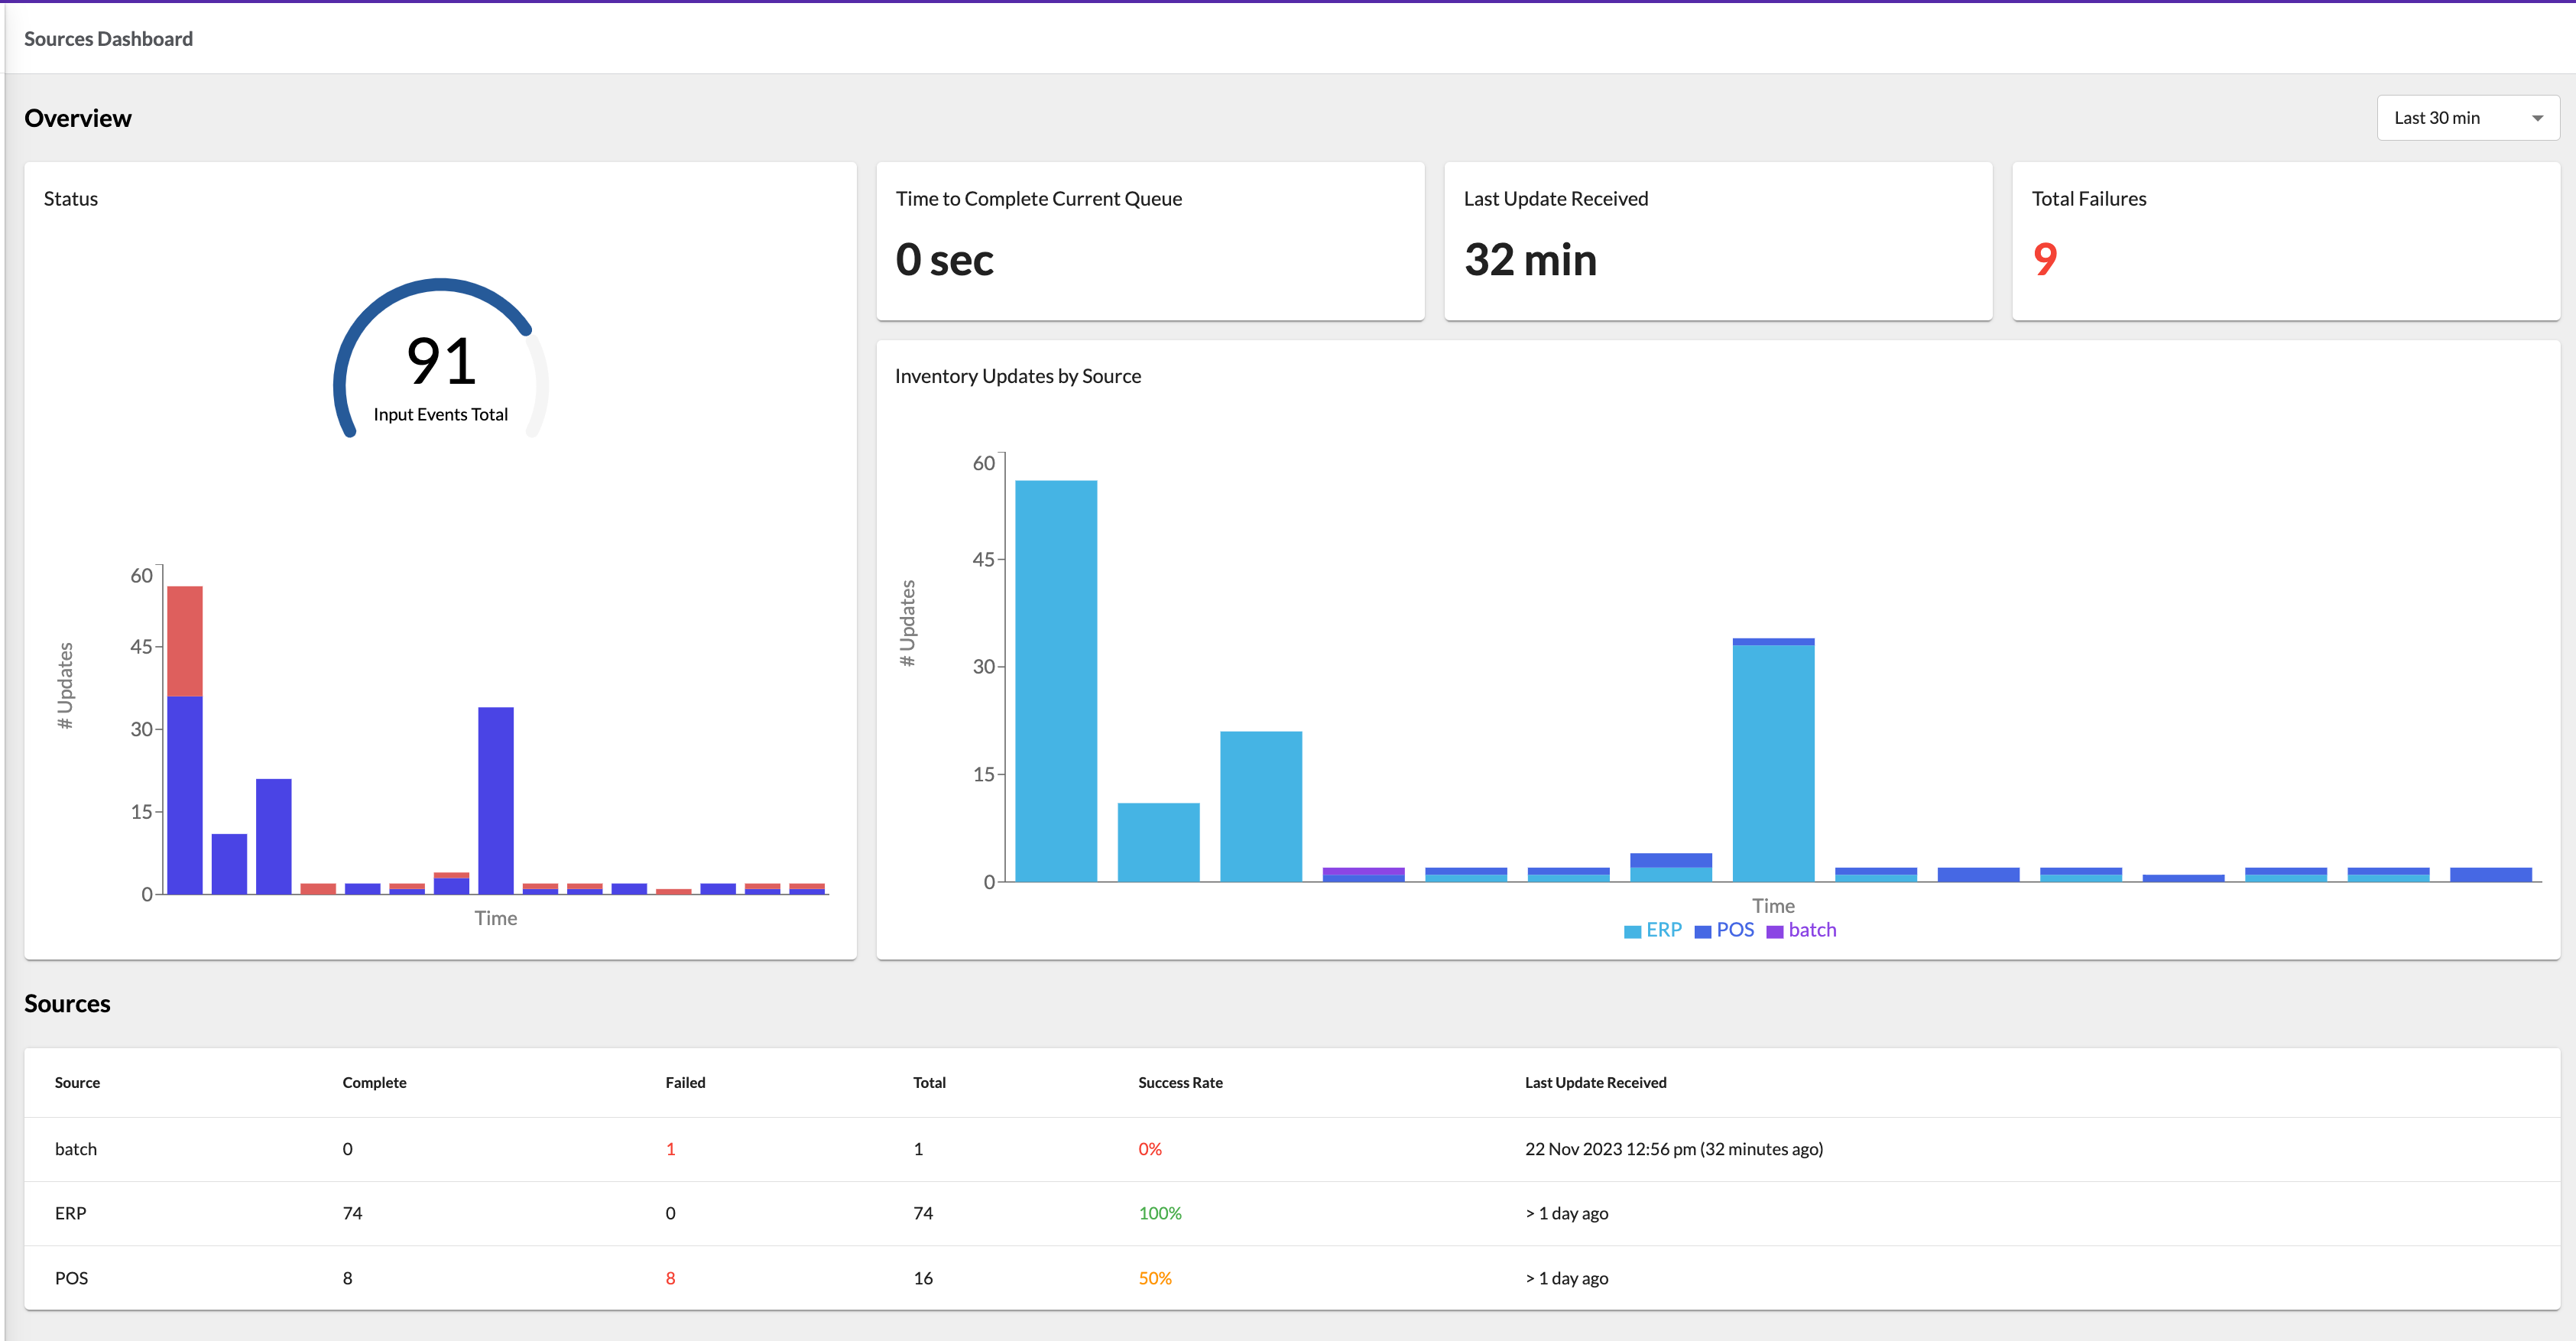
Understanding the Sources Metrics
The Sources Dashboard presents statistics on inventory events received from external systems, grouped by their source, the originating system that submitted the update. This grouping means the numbers shown are aggregated across all event types and scenarios for a given source, not a one-to-one count of batches sent or individual inventory items.It is also worth noting that the total metrics are not directly equivalent to:- The number of inventory batches submitted
- The total number of inventory records across all batches (unchanged records filtered out by BPP are excluded)
- The number of Inventory Position Updates (IPU) or Inventory Position Calculations (IPC), since a single inventory item or event can generate multiple updates
What counts as Complete or Failed?
Each Inventory Event processed by the platform is counted as either Complete or Failed:- Complete: The event was processed successfully (any status except
`FAILED`or`NO_MATCH`) - Failed: The event resulted in an error or exception (
`FAILED`), or produced no matching result (`NO_MATCH`)
How is the source value determined?
The source value used for grouping depends on the type of update:- Batch updates default to a source of
`batch`unless a different source value is defined in the batch payload. See the Inventory Batch Model for details. - Event API updates received through the Event API (synchronous or asynchronous) where the root entity type is
`INVENTORY_CATALOGUE`or`VIRTUAL_CATALOGUE`are also included. The source defaults to`event`unless a different value is provided in the event itself. - Internal events are assigned
`source=internal`and are excluded from the dashboard statistics.
Overview Section
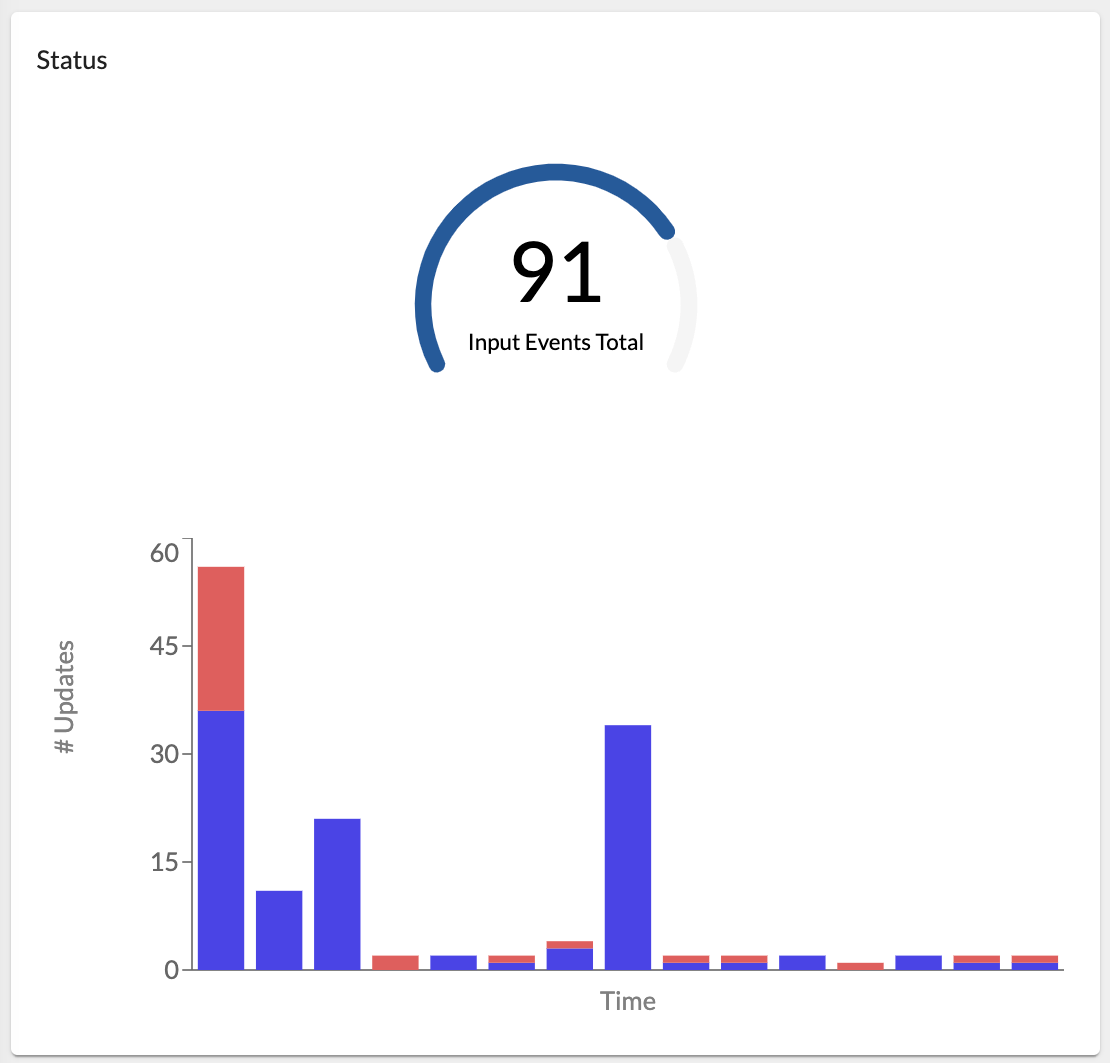
The dashboard contains five key cards:- Status – Displays inventory event data with a gauge chart (total events) and a bar chart (event breakdown by time; includes failures, represented with split colors for clarity). The gauge chart supports colored thresholds configured via a setting.
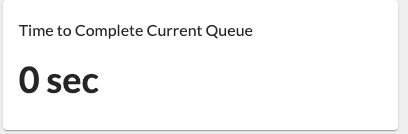
- Time to Complete Current Queue – Estimates the time required to complete the current update queue.
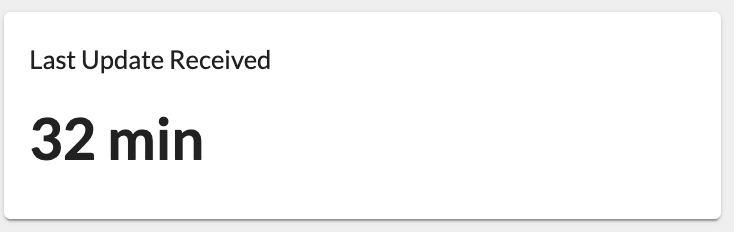
- Last Update Received – Indicates the time since the most recent inventory update.
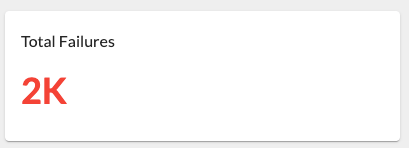
- Total Failures - Displays an aggregated number of Inventory problems or anomalies based on the Metrics data for a selected period. The Total Failures value is clickable, redirecting users to the Events page pre-filtered to enable them to identify the specific Inventory Events that have failed.
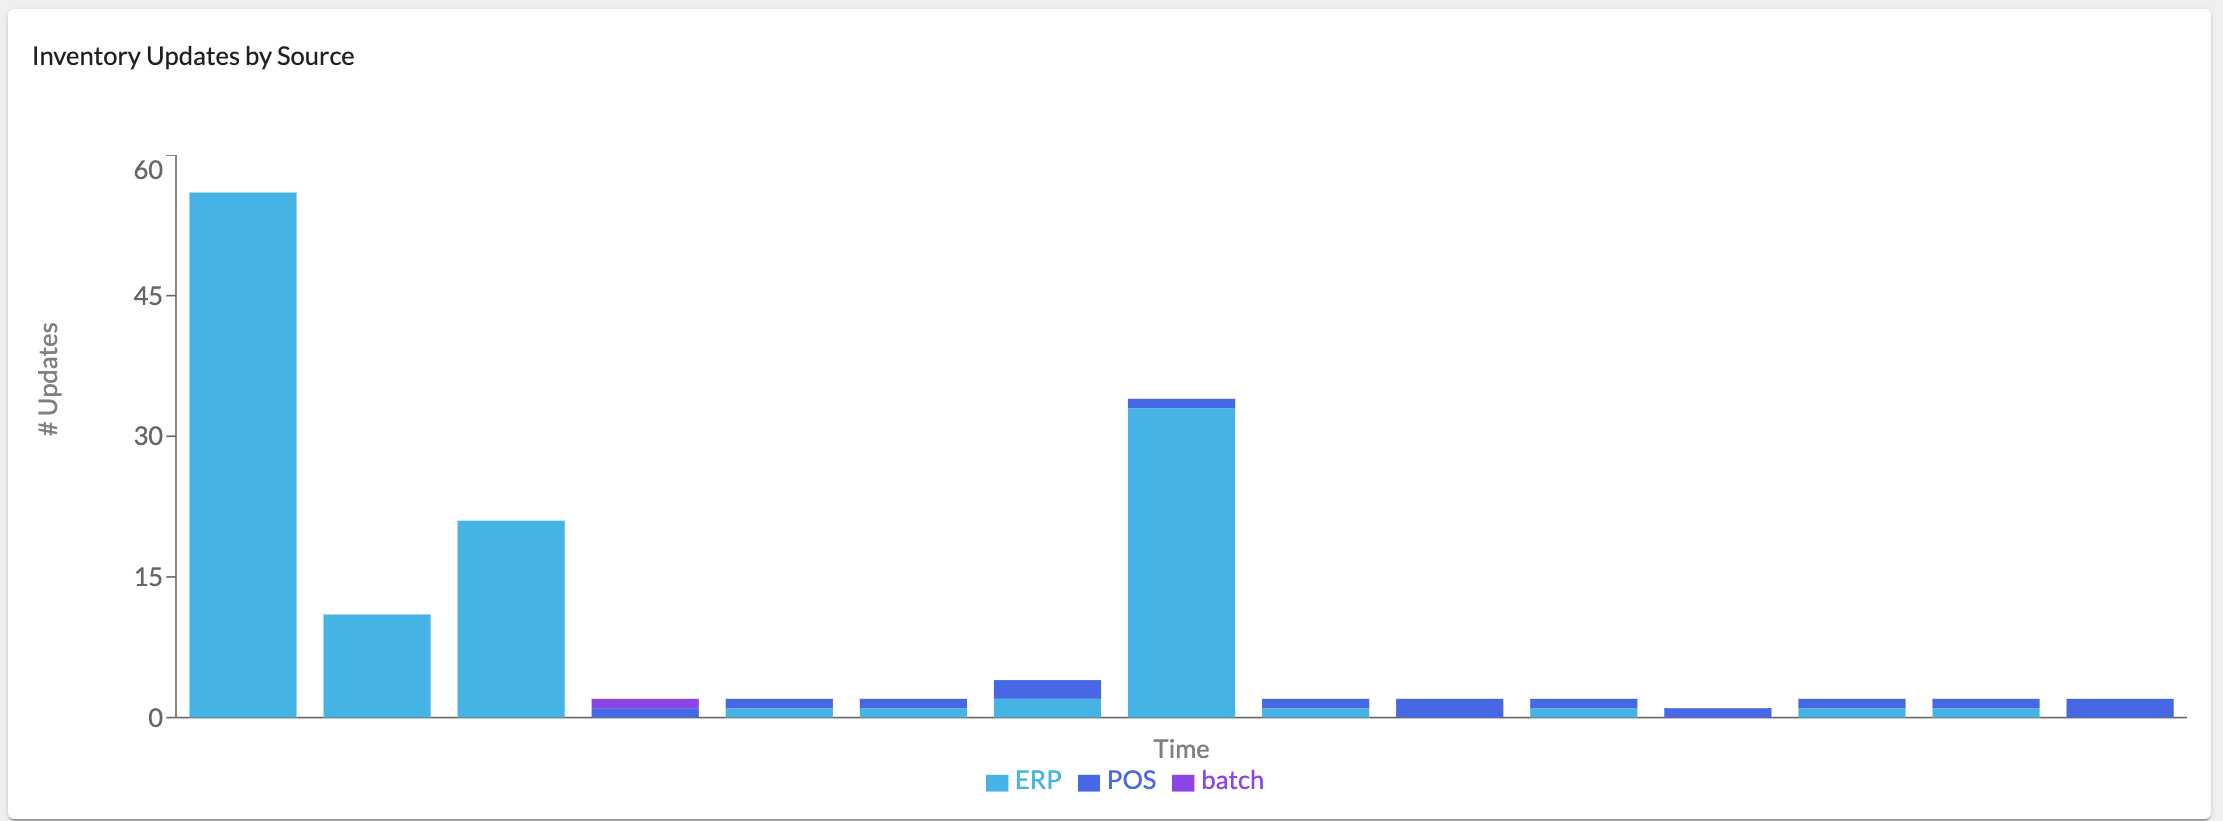
- Inventory Update by Source – Displays inventory event data segmented by source.
Sources Section
This section lists inventory update sources and their performance metrics, including:- Source – Source - The source system that submitted an inventory update event;
- Complete – The number of successfully completed inventory updates (all statuses except
`FAILED`and`NO_MATCH`); - Failed – The number of inventory updates with
`FAILED`and`NO_MATCH`statuses; - Total – The total number of Inventory updates of a particular source;
- Success Rate – A rate calculated by formula: (complete inventory updates / total inventory updates) * 100% ;
- Last Update Received—The timestamp of the most recent update. If the last update was too long ago (more than 24 hours) or not returned,"> 1 day ago" is displayed in the column.

Batch Pre-Processing (BPP) Metrics Dashboard
Overview
The BPP Metrics Dashboard provides insights into batch pre-processing of inventory data. It tracks processing efficiency, identifies data modifications, and optimizes submission strategies. For detailed guidance on how to use it, refer to How to Interpret the Batch Pre-Processing (BPP) Dashboard.The dashboard supports a rolling date range filter of up to 31 days for time-based analysis. It prevents selections from exceeding this range and applies default values when necessary. While users can select any date range within this limit, historical data is available only for the last five months. Users can navigate via the menu or a direct URL, and date parameters are automatically validated.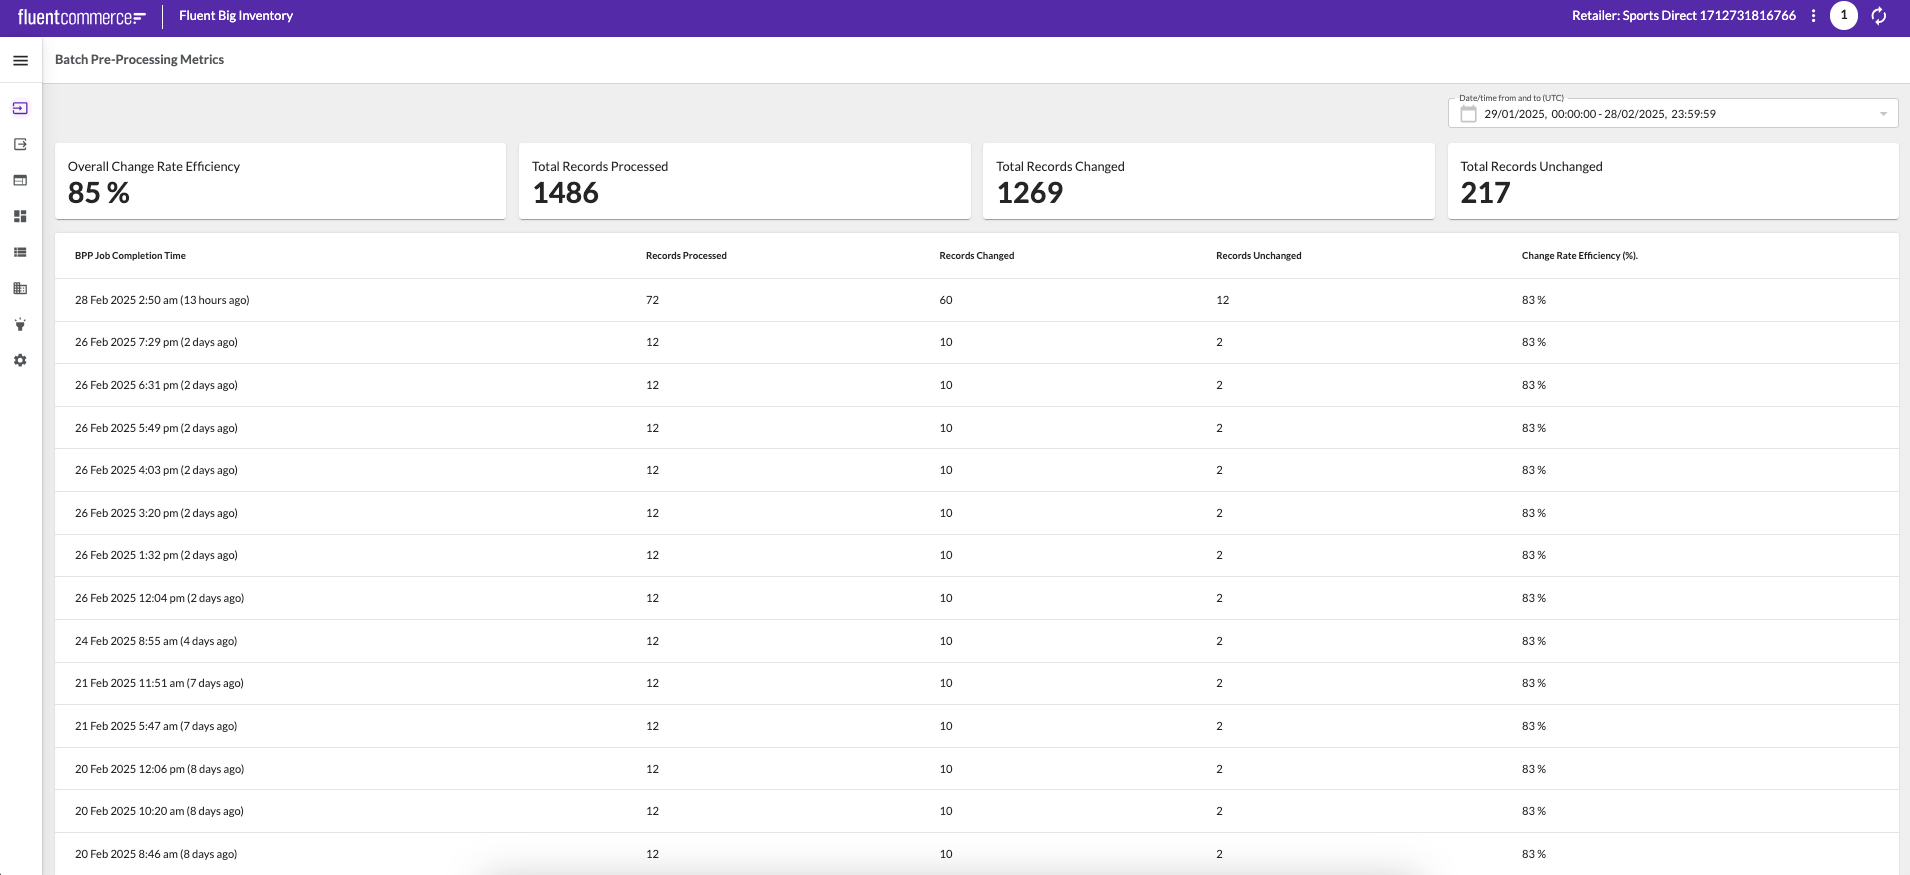
Metrics Section
The dashboard includes four key metrics:- Overall Change Rate Efficiency – Measures the proportion of modified records using the formula:
`(Total Changed Items / Total Processed Items) × 100%`for the selected date range.

- Total Records Processed – Displays the sum of all batch items processed across all jobs within the selected date range.

- Total Records Changed – Represents the total number of records identified as modified across all batch jobs within the selected date range.

- Total Records Unchanged – Indicates the total count of records that remained unchanged and were filtered out across all jobs in the selected date range.

Data Table
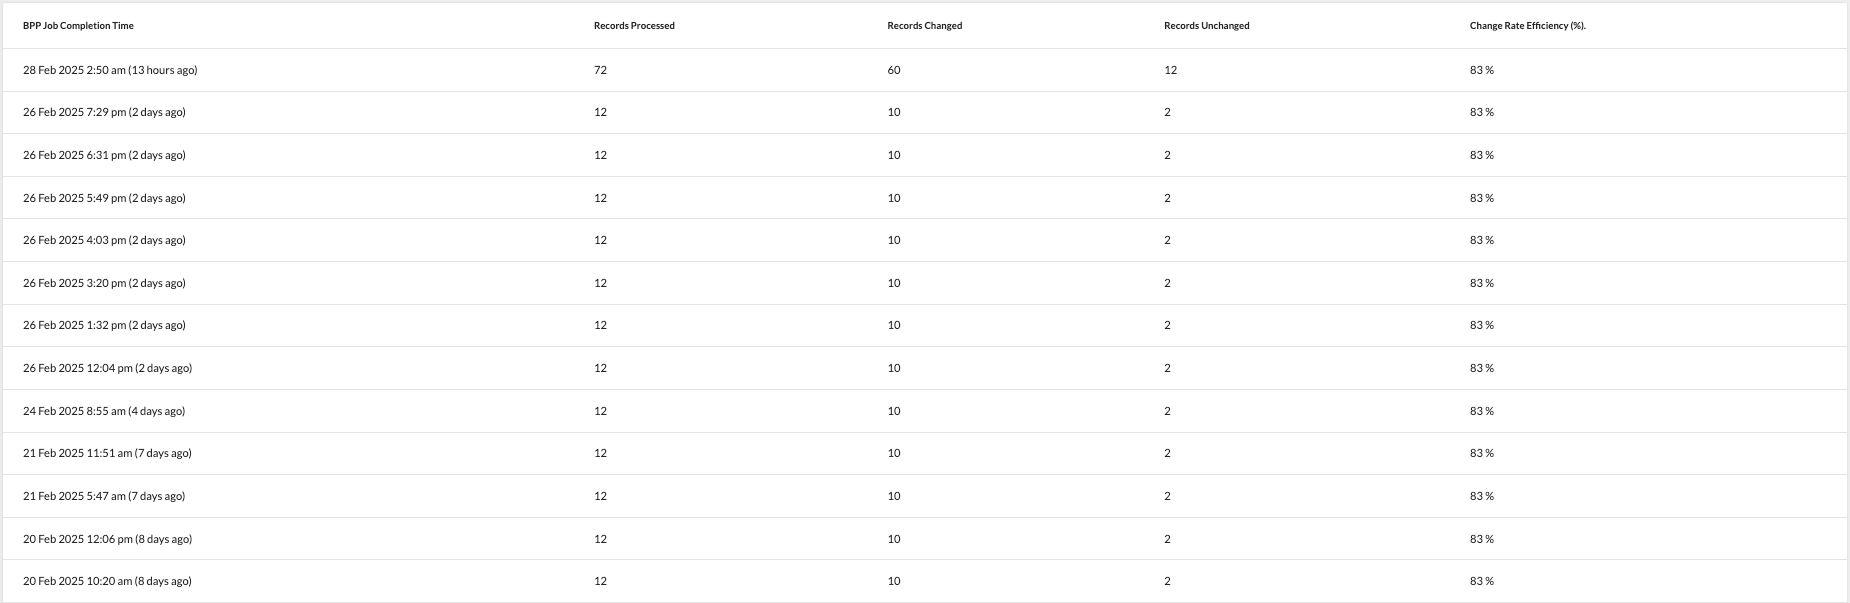
A structured table presents batch job performance data with the following columns:- BPP Job Completion Time – Displays when the job ended. Note: This timestamp reflects the job's completion before Rubix-level processing is complete;
- Records Processed – Total items processed per job;
- Records Changed – Items identified as changed;
- Records Unchanged – Items remaining unchanged;
- Change Rate Efficiency (%) – Efficiency metric calculated as
`(Changed Items / Processed Items) × 100%`per job run. Read