Metrics usage for Platform Observability
Essential knowledge
Authors:
Kirill Gaiduk, Yulia Andreyanova
Changed on:
19 June 2024
Overview
This document is intended to describe to implementers which Metrics are available within the Fluent Big Inventory product and what kind of data they provide to achieve Platform Observability.Pre-requisites:- You should have knowledge of How Metrics works.
- You should have knowledge of Events.
- You should have knowledge of Fluent APIs.
Key points
- Metrics are available for all customers with Fluent Order Management and Fluent Big Inventory.
- Metrics data is captured, uploaded, and stored in the Metrics workspace.
- Metrics data is fetched and visualized for the Platform Observability enablement.
What is Metrics?
Metrics are numerical measurements that are:- Captured by instrumenting the source code.
- Sent through a telemetry data manager to be stored in a monitoring system.
- Saved with time series data format that refers to recording changes over time.
- Visualized to provide visibility of the Platform operational data and allow to monitor and observe Platform / Inventory availability and orchestration insights.
Metrics vs. Events
An Event is typically used to log a specific activity of what has happened within the system.While the Metrics (or Metrics API) themselves do not capture events, they provide a capability to reflect an aggregated view for a range of captured events, which include:- Cross-retailer events,
- Events initiated through GraphQL mutations (create events),
- Cross workflow events,
- User action events via the sync endpoint,
- Events instigated through the async endpoint,
- Scheduled events.
- POST /api/v4.1/event/async
- POST /api/v4.1/event/sync
- POST /api/v4.1/job/{jobId}/batch
Types
The following Metric types are currently available:- Counter
A cumulative Metric representing a monotonically increasing counter. The value can only increase or be reset to zero upon process restart. - Gauge
Represents a single numerical value that can vary up and down. - Histogram
Samples observations (e.g., request durations, response sizes) and counts them in configurable buckets. Offers insights into data distribution.
Labels
Labels are saved as a part of the specific Metric to enable Metrics data filtering when fetched with the Metrics API queries. Label examples include (a list of all Metrics and supported labels can be found in the Available Metrics section below):- account_id
Fluent account identifier. - retailer_id
Fluent retailer identifier (within the account). - event_name
Describes the event name. - entity_type
Classifies the entity being referred to in the event.
- source
Specifies the origin of the event or the medium through which the event was channelled.
- le (specific to Histograms)
`le`stands for "less than or equal to". It labels the buckets in a histogram and represents the upper bound of each bucket.
Available Metrics
The following Metrics are currently available:Fluent API Metrics
| Name | Type | Labels | Description |
| core_event_received_total | Counter | account_id, retailer_id, event_name, entity_type, source | The number of events received by the Fluent platform. |
| core_event_last_received_seconds | Gauge | account_id, retailer_id, event_name, entity_type, source | The last timestamp of events received by the Fluent platform. |
Orchestration Engine (Rubix Core/Batch) Metrics
| Name | Type | Labels | Description |
| rubix_event_received_total | Counter | account_id, retailer_id, event_name, entity_type, source | The number of events received by the orchestration engine (Rubix) from the queue or direct HTTP API. |
| rubix_event_inflight_latency_seconds | Histogram | account_id, retailer_id, event_name, entity_type, source | The amount of time an event stays in the internal queue before Rubix receives it. |
| rubix_event_inflight_latency_seconds_sum | Counter | account_id, retailer_id, event_name, entity_type, source | Total accumulated time of events in the internal queue before Rubix receives them. |
| rubix_event_inflight_latency_seconds_count | Counter | account_id, retailer_id, event_name, entity_type, source | The number of observed events in the internal queue before Rubix receives them. |
| rubix_event_inflight_latency_seconds_bucket | Counter | account_id, retailer_id, event_name, entity_type, source, le | Bucketed counts of event latencies in the internal queue. |
| rubix_event_runtime_seconds | Histogram | account_id, retailer_id, event_name, entity_type, source, status | The amount of time Rubix takes to execute an event. |
| rubix_event_runtime_seconds_sum | Counter | account_id, retailer_id, event_name, entity_type, source, status | Total accumulated time taken by Rubix to execute events. |
| rubix_event_runtime_seconds_count | Counter | account_id, retailer_id, event_name, entity_type, source, status | The number of observed events Rubix executed. |
| rubix_event_runtime_seconds_bucket | Counter | account_id, retailer_id, event_name, entity_type, source, status, le | Bucketed counts of event runtimes by Rubix. |
Batch Pre-Processing Metrics
The Metrics are captured from the Inventory Deduplication job:| Name | Type | Labels | Description |
| bpp_records_processed_total | Counter | account_id, run_id, stage, first_batch_received, deduplication_finished | The total amount of all batch items processed by the Inventory Deduplication job.The `first_batch_received` label is used to indicate the date of the first batch.The `deduplication_finished` label is used to indicate the end date of the Inventory Deduplication job execution. |
| bpp_records_unchanged_total | Counter | account_id, run_id, stage | The total amount of batch items that were filtered out by the Inventory Deduplication job. |
| bpp_records_changed_total | Counter | account_id, run_id, stage | The total amount of batch items that were considered “changed” and sent to Rubix by the Inventory Deduplication job. |
| bpp_last_run_timestamp_seconds | Gauge | account_id, run_id, stage, status | The timestamp for when the given Batch Pre-Processing operation has been completed.Status: `SUCCESS`, `ERROR`. |
Inventory Feeds Metrics
The Metrics are captured from the Inventory Data Loading job:| Name | Type | Labels | Description |
| feed_sent_total | Counter | account_id, feed_ref, run_id, data_type | The total number of records exported by the Inventory Data Loading job, split by data type.Data type: `INVENTORY_POSITION`, `INVENTORY_CATALOGUE`, `VIRTUAL_POSITION`, `VIRTUAL_CATALOGUE`. |
| feed_last_run_timestamp_seconds | Gauge | account_id, feed_ref, run_id, status | The timestamp for when the Inventory Data Loading job completed.Status: `SUCCESS`, `ERROR`, `NO_RECORDS`.`NO_RECORDS` refers to the scenario where the job is triggered but no records have been updated, so there is nothing to export from the feed. |
Metrics Capturing
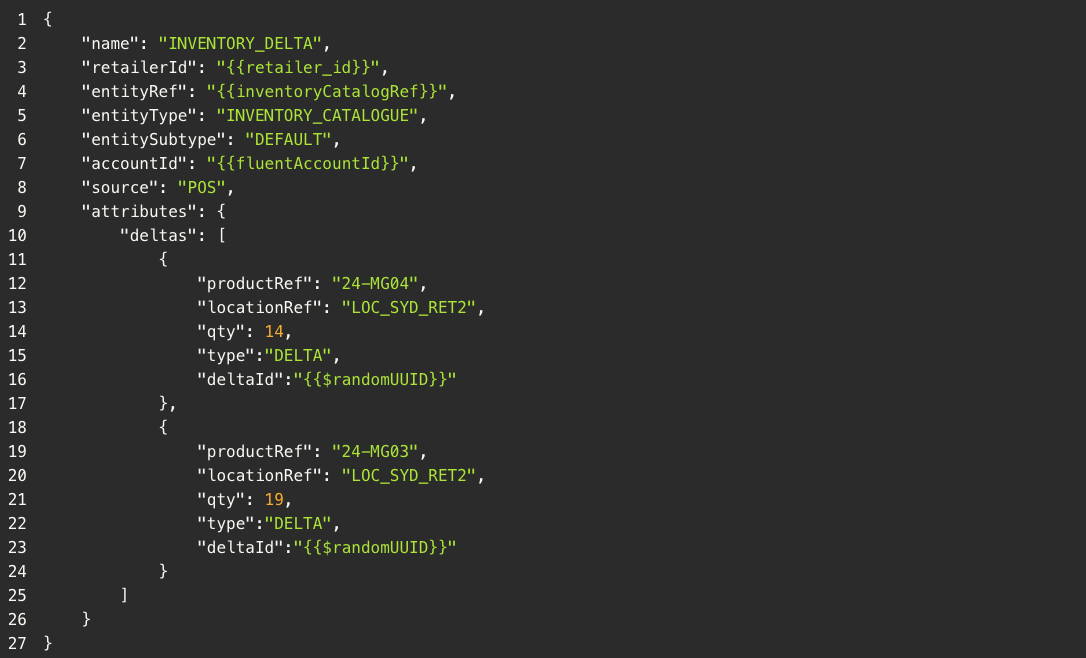
The Metrics capturing is a foundation and a starting point for building a reliable data source to enable Platform Observability. The following example for Inventory Update end-to-end flow (via the customer’s request based on Point Of Sale (POS) data) is intended to serve as a reference for Metrics Capturing Process.Explanation through an Example
 The correspondent Metrics (the number of events received and their runtime) are logged upon:
- Receiving of an Inventory Update customer’s request (based on the POS data) by Fluent Platform.
- Starting the Inventory Catalogue Workflow for proceeding with the latest Inventory updates (e.g. reflecting a sale transaction) to ensure up-to-date On Hand quantities.
- Starting the Virtual Catalogue Workflow for updating Available to Sell quantities.