Getting Started with Metrics API
Essential knowledge
Authors:
Kirill Gaiduk, Girish Padmanabha
Changed on:
19 June 2024
Overview
This guide is intended to provide implementers with information about the Metrics API within the Fluent Big Inventory product, describing its functionalities and utilization principles within the Fluent Platform.Pre-requisites:- You should have knowledge of How Metrics works.
- You should have knowledge of Metrics usage for Platform Observability.
- You should have knowledge of GraphQL.
- You should configure your User role with
`METRICS_VIEW`permission for Metrics data access.
Key points
- Metrics data is fetched and visualized for the Fluent Platform Observability enablement.
- Use
`metricInstant`and`metricRange`GraphQL queries to retrieve the Metrics data. - Prometheus Query Language is utilized for the Metrics API queries construction.
What is Metrics API for?
The Metrics API is a part of GraphQL API acting as a proxy between the Fluent Platform and the Metrics workspace in order to provide the necessary Metrics data for visualization with Fluent OMX UX framework, including:- Charts
- Diagrams
- Tables
- Dashboards
Queries
The following Metrics API query operations are currently available to retrieve customer Metrics data:`metricInstant`
Designed to execute an instant query at a specific time, returning a single data point for the specified Metric at that exact time.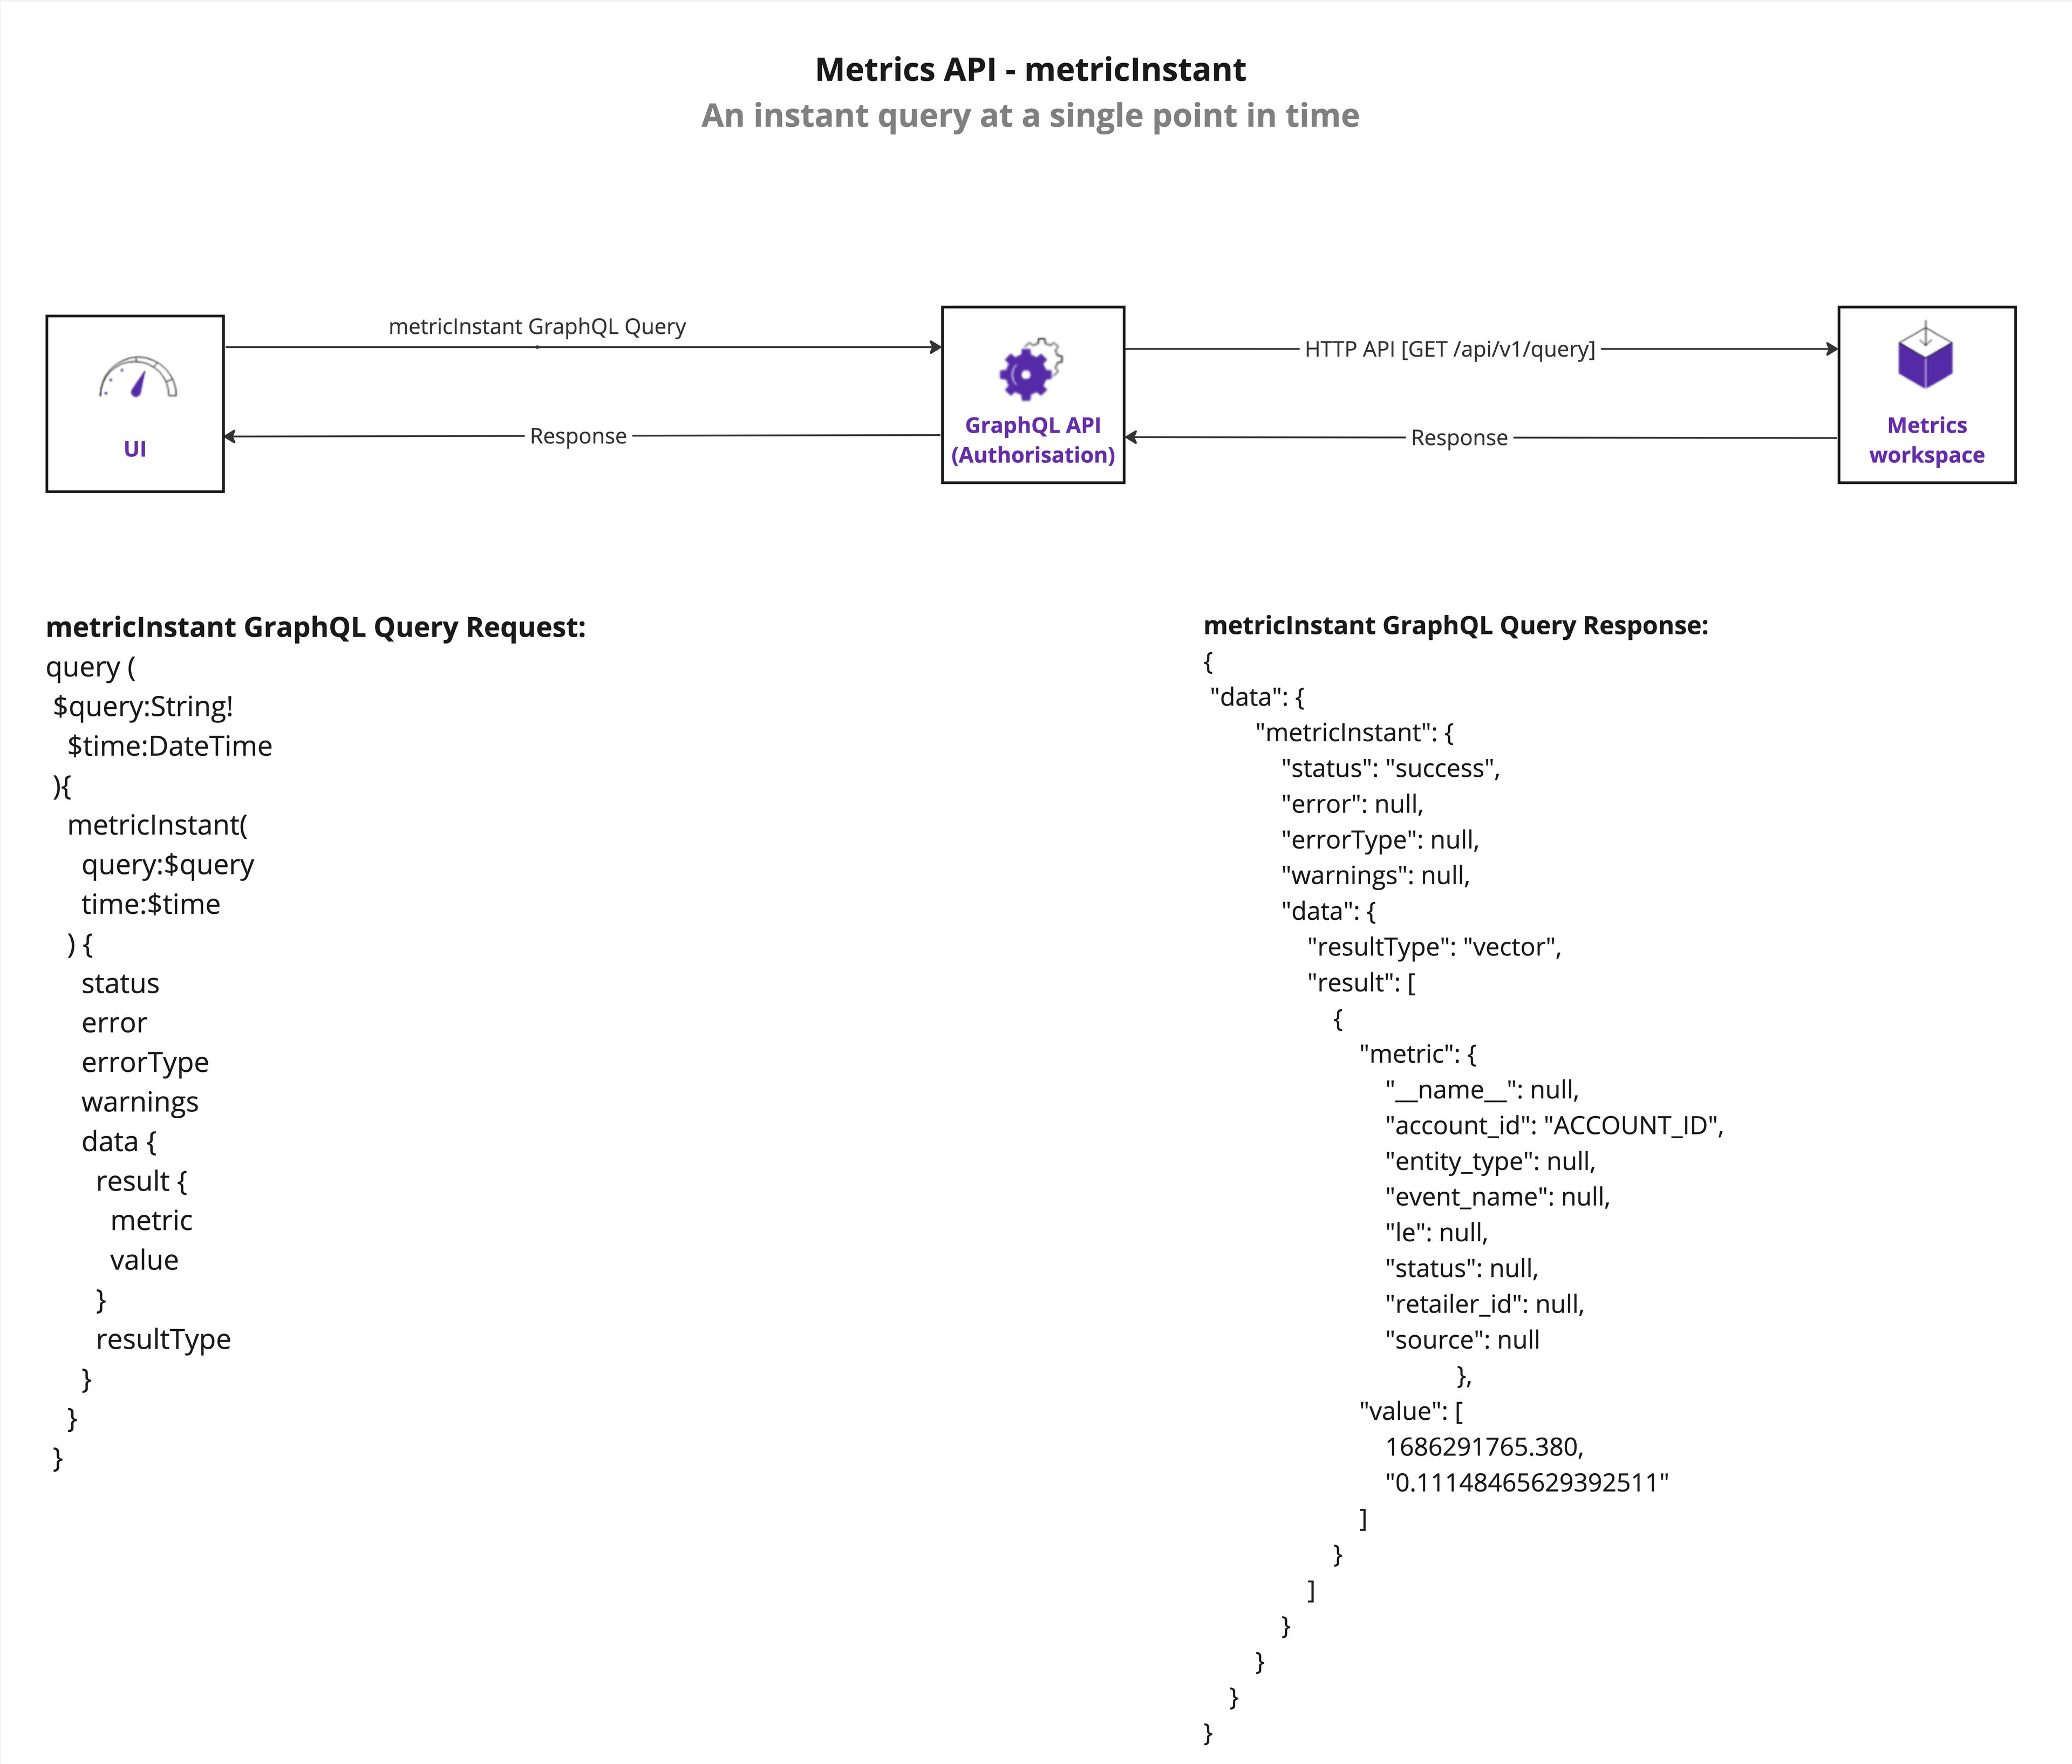
`metricRange`
Executes a range query over a predefined duration, outputting a series of data points for the Metric from start to end at intervals determined by the step value.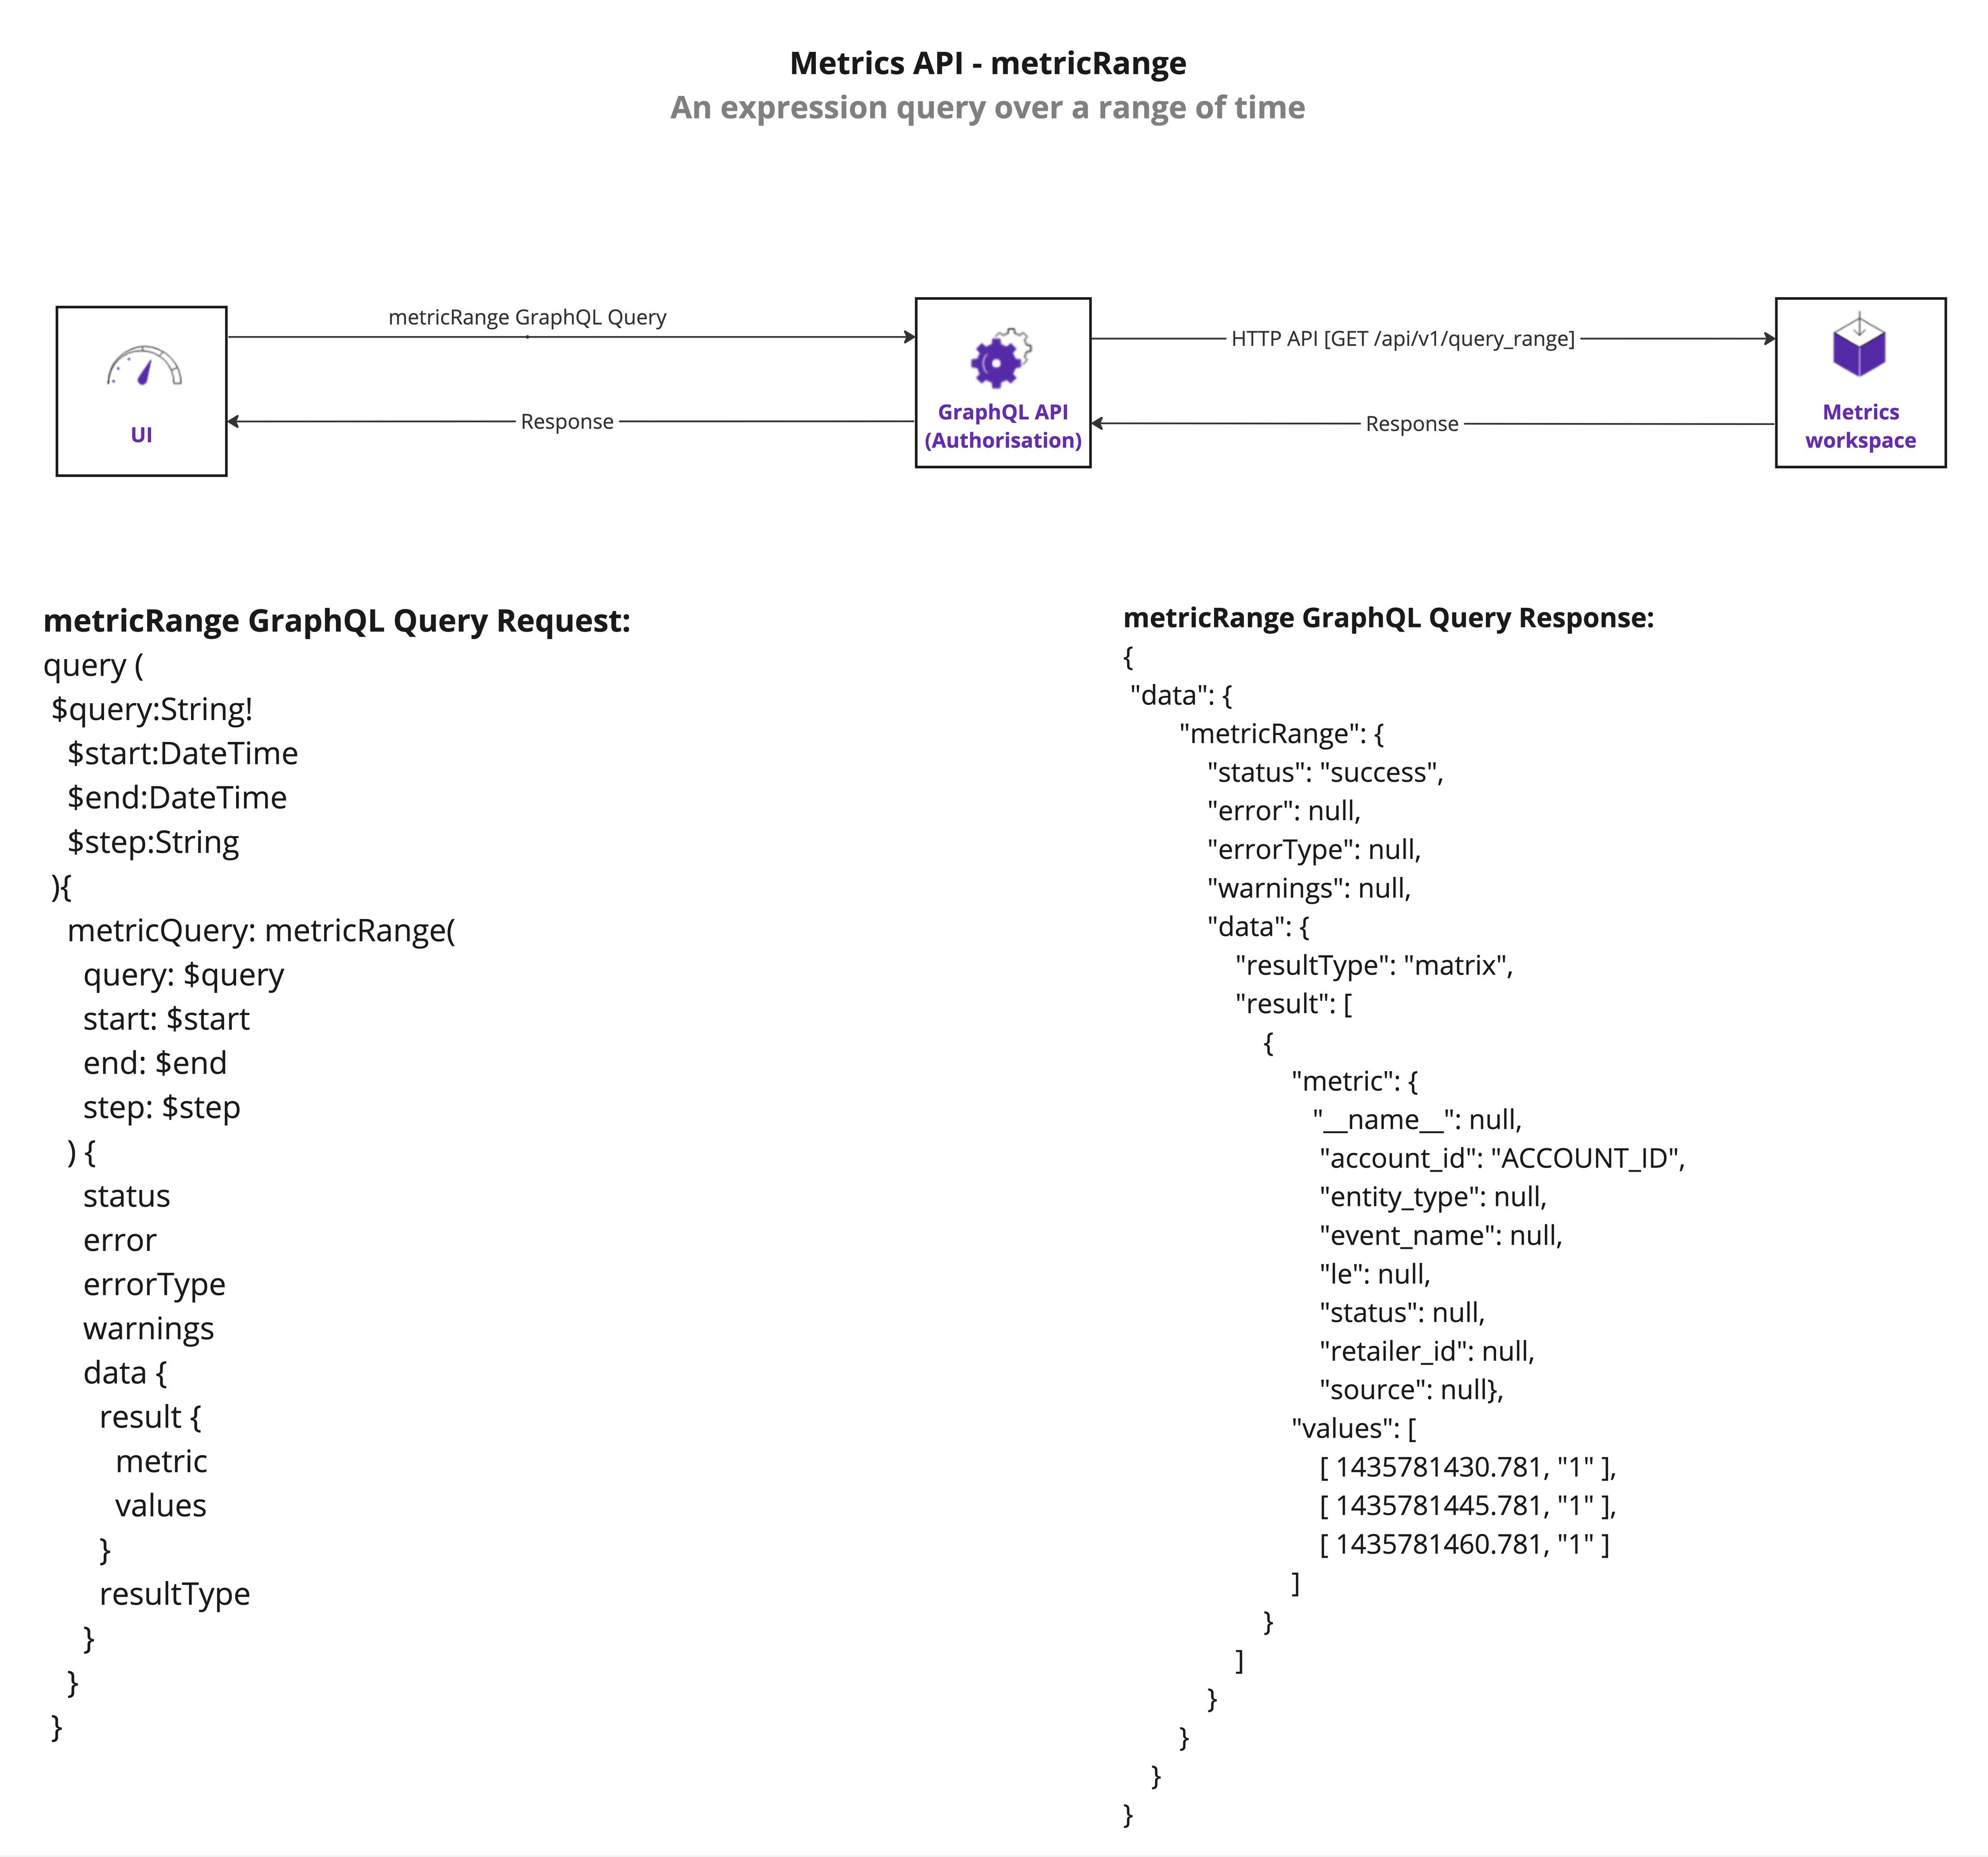
Query Parameters
Available Metrics API queries are configurable with the following parameters:| Query Name | Parameter | Mandatory/Optional | Type | Format | Default value (when not specified) | Description |
`metricInstant` | query | Mandatory | `String` | Prometheus Query Language (PromQL) | The query string for a Metric. See the details in the Query Syntax section below. | |
| time | Optional | `DateTime` |
| Current server time in UTC | The timestamp for a Metric query evaluation. | |
`metricRange` | query | Mandatory | `String` | PromQL | The query string for a Metric. See the details in the Query Syntax section below. | |
| start | Optional | `DateTime` | 30 minutes before the current server time in UTC | Start of fetch range. | ||
| end | Optional | `DateTime` | Current server time in UTC | End of fetch range. | ||
| step | Optional | `String` | 1 minute | Retrieval interval within the range. |
Query Syntax
The Metrics API uses the Prometheus Query Language (PromQL), a functional query language designed for real-time selection and aggregation of time series Metrics data. Valid PromQL Syntax should be inserted into the`metricInstant` and `metricRange` Metrics API queries as the `query` parameter value.Query Response
The Metrics API query Response can be displayed in the UI with OMX UX framework components, e.g.:Metrics API Schema
Metrics workspace server sends the Metrics API query Response that is mapped back following the Metrics API schema.1scalar Json
2
3type Query {
4 # An instant query at a single point in time
5 metricInstant(query: String!, time: DateTime): MetricInstant
6 # An expression query over a range of time
7 metricRange(query: String!, start: DateTime, end: DateTime, step: String): MetricRange
8}
9
10type MetricInstant {
11 status: String!
12 data: MetricInstantData
13 errorType: String
14 error: String
15 warnings: [String]
16}
17
18type MetricInstantData {
19 resultType: String
20 result: [VectorInstant]
21}
22
23type VectorInstant {
24 metric: Json
25 value: [Json]
26}
27
28type MetricRange {
29 status: String!
30 data: MetricRangeData
31 errorType: String
32 error: String
33 warnings: [String]
34}
35
36type MetricRangeData {
37 resultType: String
38 result: [VectorRange]
39}
40
41type VectorRange {
42 metric: Json
43 values: [[Json]]
44}Response Data Structure
Metrics API query Response is provided to the user with the following Data Structure (based on the Metrics API schema):| Structure Name | Field | Type | Mandatory/Optional | Description |
`MetricInstant` | status | String | Mandatory | Query status (e.g., "success,” "error"). |
| data | MetricInstantData | Optional | Query result. | |
| errorType | String | Optional | Error type. | |
| error | String | Optional | Detailed error. | |
| warnings | Array of String | Optional | Warning messages. | |
`MetricInstantData` | resultType | String | Optional | Usually "vector". |
| result | Array of VectorInstant | Optional | Metric data. | |
`VectorInstant` | metric | Json | Optional | Metric labels/values. |
| value | Array of Json | Optional | Timestamp and value. | |
`MetricRange` | status | String | Mandatory | Range query status. |
| data | MetricRangeData | Optional | Query result. | |
| errorType | String | Optional | Error type. | |
| error | String | Optional | Detailed error. | |
| warnings | Array of String | Optional | Warning messages. | |
`MetricRangeData` | resultType | String | Optional | Result type. |
| result | Array of VectorRange | Optional | Data points within range. | |
`VectorRange` | metric | Json | Optional | Metric labels/values. |
| values | Array of Array of Json | Optional | Timestamps and values. |
Response Value Field Array
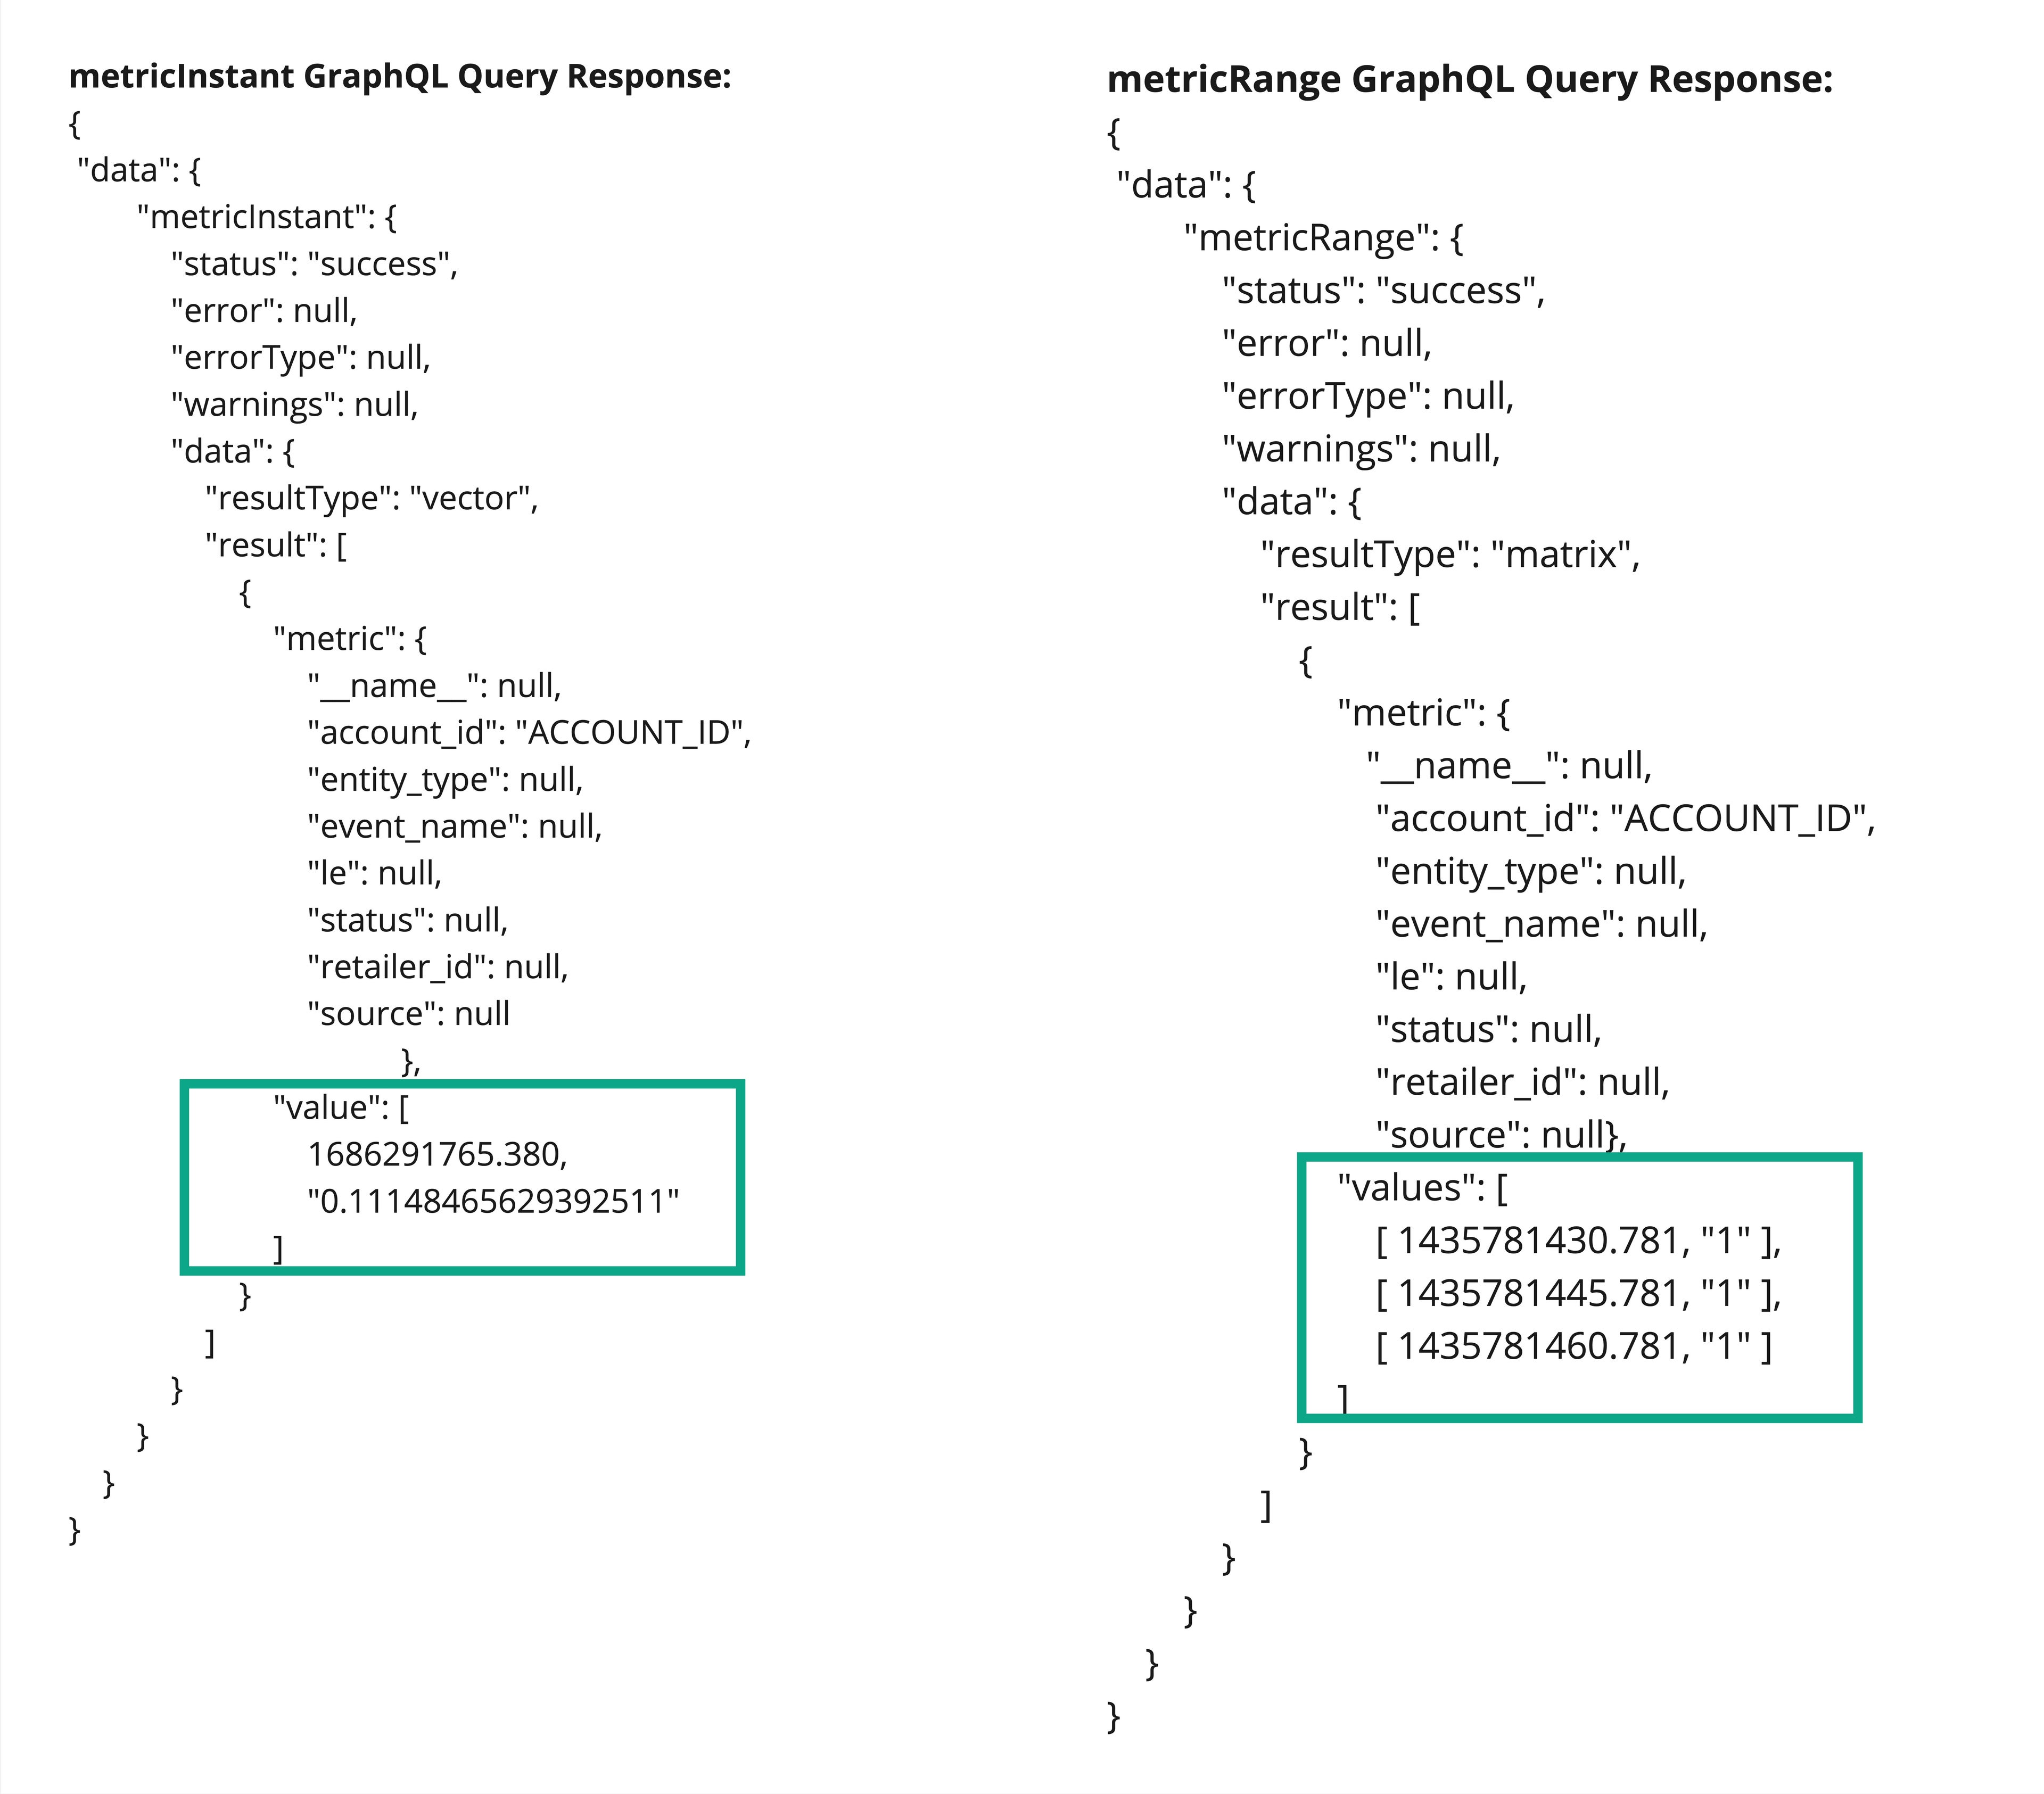
- The initial field symbolizes the UNIX timestamp for the Metric.
- The subsequent field denotes the Metric value corresponding to the above-mentioned timestamp.
No Precise Data Match Handling
- For a
`metricInstant`query targeting a specific time without an exact data match:- Stale Data Management: The platform identifies data as "stale" if no new data point emerges within the default span (5 minutes). Stale data is excluded from outputs.
- Data Interpolation: The platform will automatically fetch data from the latest noted point preceding the queried timestamp.
- For a
`metricRange`query from start to finish with a defined step:- Continuous Data Interpolation: When a distinct timestamp within the range lacks data, the platform defaults to the closest prior data point for that timestamp. This guarantees continuous data points in the range query, even if some values are interpolated.
- Range Data Structure: The values field in VectorRange houses data point arrays, reflecting the sequence of values throughout the designated time range.
Inaccurate Metric Querying Result
- An error won’t be presented when an erroneous Metric (like core_event_received_incorrect) is queried.
- A success acknowledgment accompanied by empty result values will be received instead.
Reference Query
The Sources Dashboard visualizes Inventory Metrics and displays user-friendly information by querying inventory-related Metrics data. The following example (powering the dashboard gauge chart) is intended to serve as a reference for Metrics API queries building / configuring.Explanation through an Example
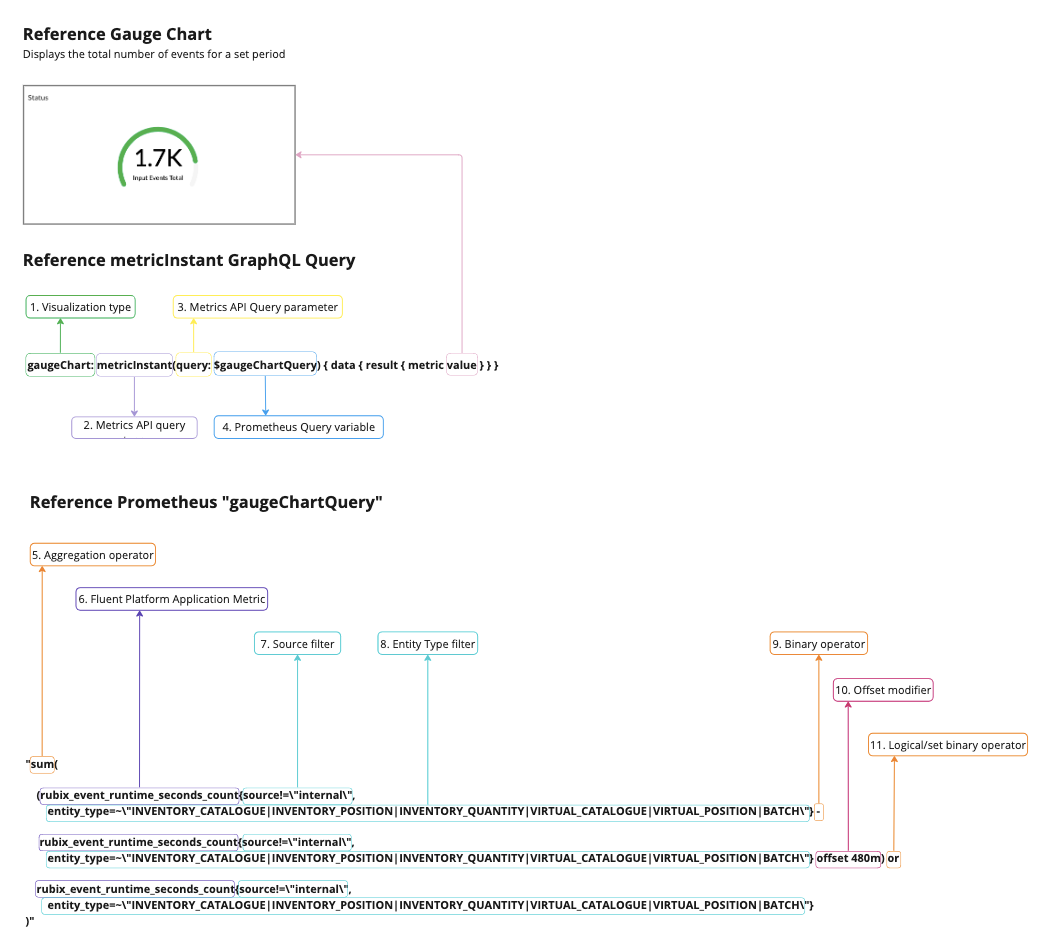 1.
1. `gaugeChart` represents Instant Metric data for a gauge chart.2.
`metricInstant` is an Instant Query at a single point in time.3.
`query` is a mandatory Metrics API query parameter containing a query string for a Metric.4.
`$gaugeChartQuery` is a variable for Prometheus-style Metric query tailored for capturing the difference in event counts over a specified time range or the total event count for specific sources and entity types.5.
`sum()` aggregates data by summing up all matching time series.6.
`rubix_event_runtime_seconds_count` is a counter Metric (from `rubix_event_runtime_seconds` histogram Metric) that shows the number of observed events executed by the orchestration engine (Rubix).7. Source Filter value
`!=\"internal\"` ensures that internal events are excluded from the count.8. Inventory Entities to be considered in the query are specified with the
`entity_type`. 9. Subtraction helps to calculate the difference in event counts over a specified time range.
10.
`offset` set up the difference in Metrics counts for now vs 480 minutes ago.11.
`or` clause is utilized to return the current count of `rubix_event_runtime_seconds_count` when the difference in counts (now vs 480 minutes ago) has no data.