Feeds Interface
Essential knowledge
Intended Audience:
Business User
Author:
Fluent Commerce
Changed on:
30 July 2025
Overview
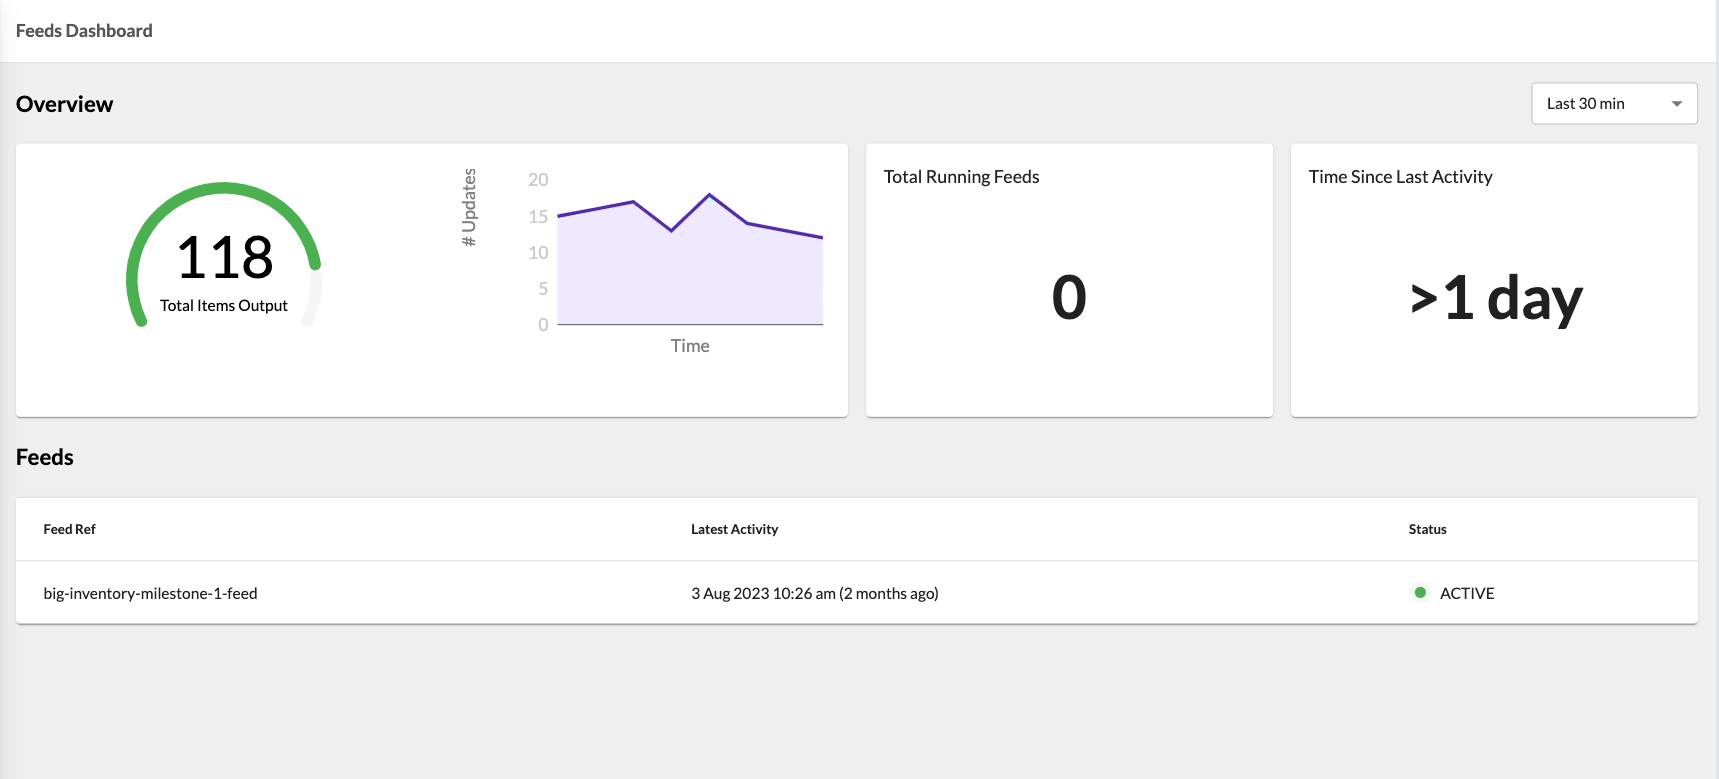
The Feeds interface provides visibility into inventory feeds for an account, enabling monitoring and analysis of feed activity over selected time periods.It includes:- Feeds Dashboard—This dashboard displays general information about inventory feeds within the selected time frame (default: last 30 minutes, 1 hour, 8 hours, 24 hours). Learn how to configure custom periods in this guide. The dashboard consists of:
- Overview: Summarizes overall feed status and key metrics.
- Feeds: Lists individual feed details for deeper insight.
Key points
- You should know about Inventory Feeds.
- The Feeds Dashboard offers a comprehensive overview of inventory feeds. It presents general information for selected periods and provides users with insights into their account's feed activities.
 Overview BlockThe Overview block contains three cards: Output Volume, Total Running Feeds, and Time Since Last Activity.The Output Volume card displays the number of records in the inventory feed for a selected period. The data is presented in 2 charts:The gauge chart shows the total items output for a set period. The chart supports colored thresholds configured via a setting. Read more about colored thresholds In this guide.The area chart displays the same data as a gauge chart divided by minutes, e.g., in the last 30 minutes, the feed has run ten times, and the chart displays the number of records in each feed.
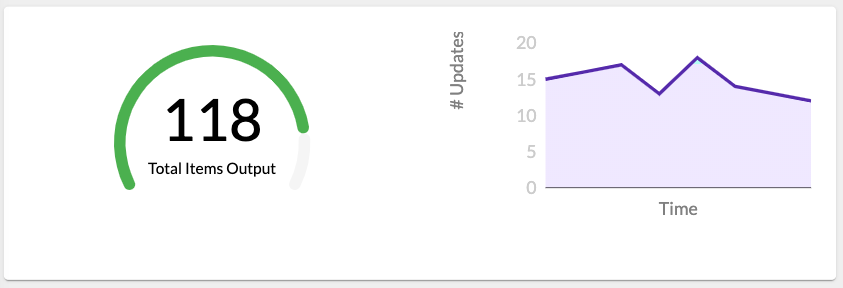 The Total Running Feeds card displays the number of feeds running now. In case there is no running feed, 0 is shown.
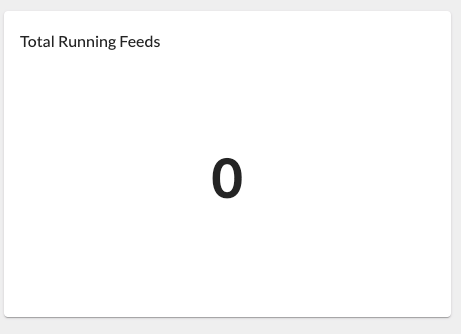 The Time Since Last Activity card displays how long it has been since a feed last finished.
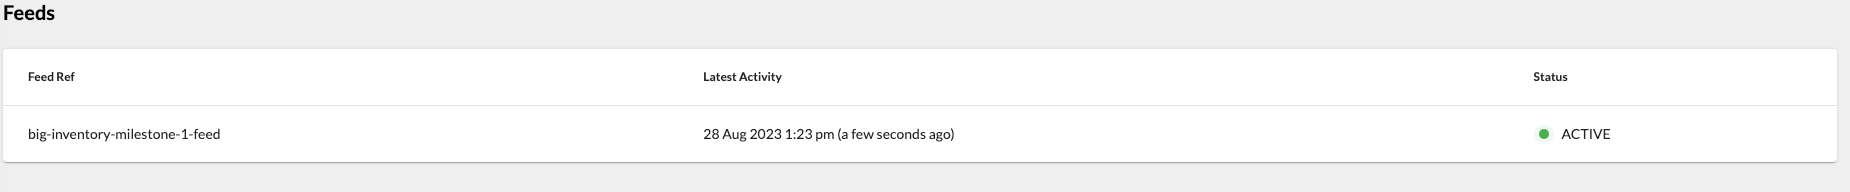
 Feeds BlockThe Feeds block contains a table listing all inventory feeds. The table displays the following information: Feed Ref, Latest Activity, and Status (Active or Inactive).