Author:
Lesley Dean
Changed on:
5 Sept 2025
`devrel.provider.rest` component to display information from the Fluent REST APIs using standard the standard UX Component Library`SendWebhook` Rule from the Core Module in a Workflow.Every Webhook action produced is logged in the Orchestration Audit Events, accessible via the Events screen in the Fluent OMS web app or through the Event API.Webhooks are often an important part of an entity's lifecycle, and as such, it is important to monitor Webhooks sent by the Fluent Platform regularly to ensure that no issues occur and cause significant delays in fulfilling your customer's orders.While you could use Events screen in the Fluent OMS web app, or even add a new page using the default `fc.events.search` component with preconfigured filters, this doesn’t provide the most relevant information in the list specific to Webhooks.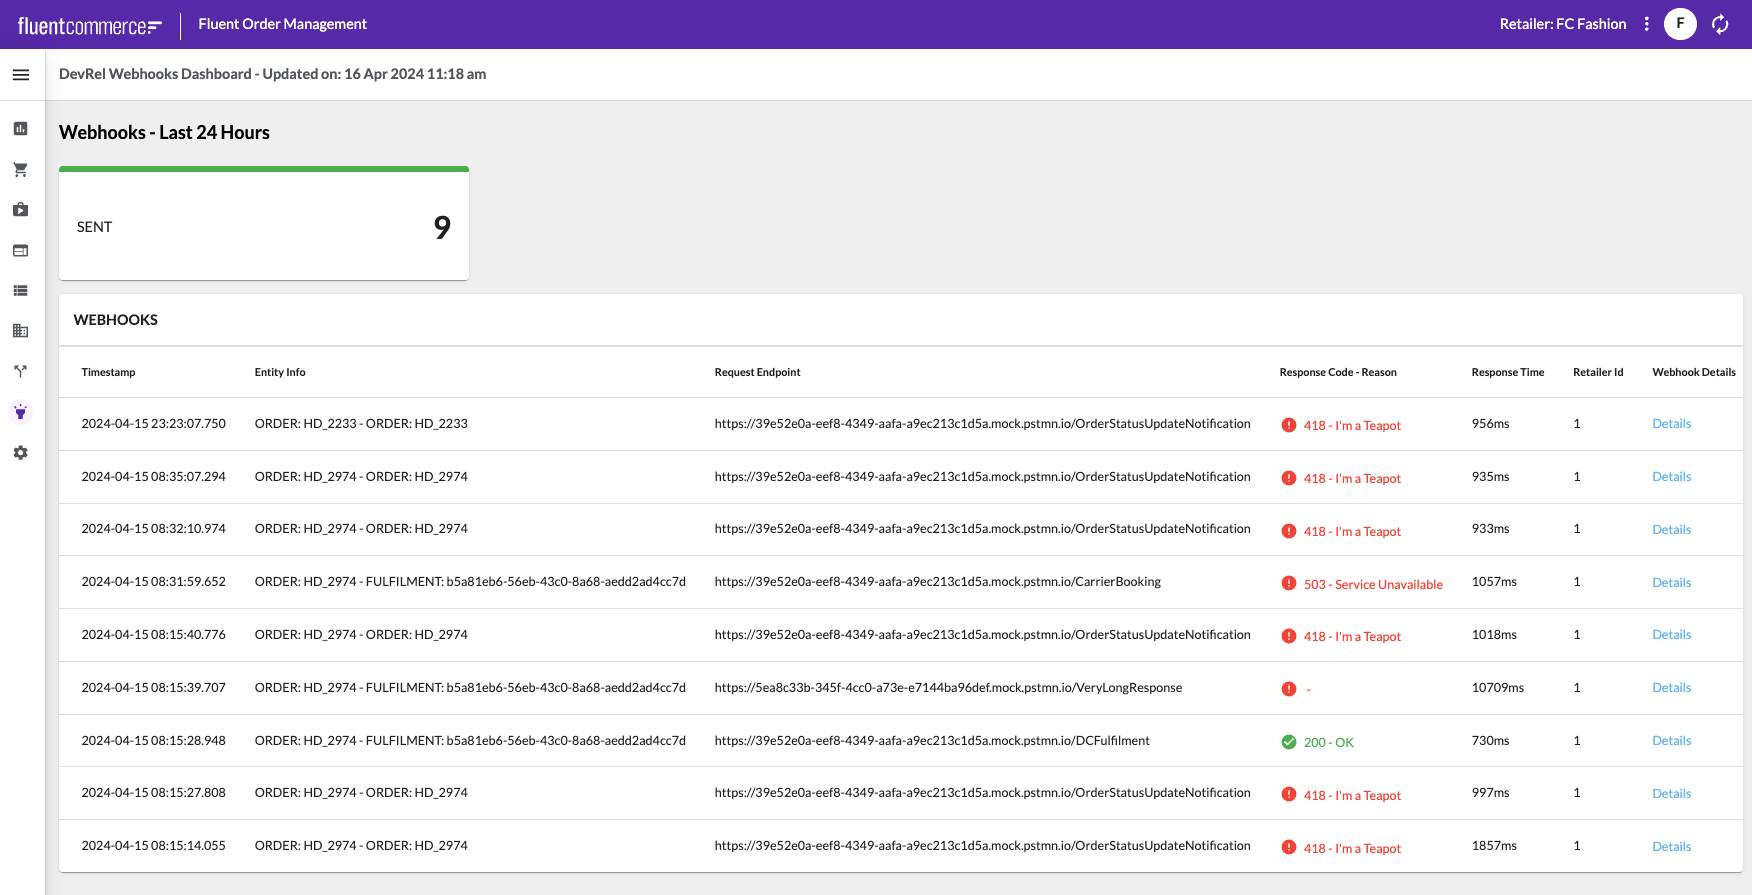 A Webhooks Dashboard for monitoring Webhooks in Fluent OMS (Zoom Image)
`fc.manifest.fragment.oms.insights.json` file, add the following snippet to the `pages` array on the section route:The snippet above defines a new page on path `devrel-webhooks-dashboard`, using the standard `fc.page` component.Additionally, it sets the `nav` details for display in the left navigation menu, sets the page title, and added a simple section header descendant (child component).`descendants` array of the `fc.page` component, beneath the section header, add the following snippet:In this snippet, we’ve configured the `devrel.provider.rest` component to call the Fluent Event API, and see the filter criteria via the `props` object.To retrieve the Audit events for Webhooks, we query the Event API for Events with a name of “Send Webhook”, and a category of “ACTION”. Additionally, we’ll query the last 24 hours by setting the `from` parameter to a relative timestamp from now.`devrel.provider.rest` component declaration:To display the count, we simply set the value to the results array length.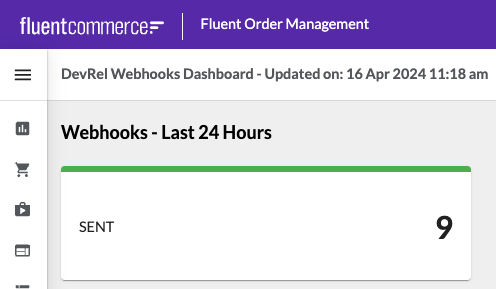 A Standard Dashboard Threshold Tile Component showing the total Webhooks sent in the last 24 hours
`generatedOn` field, including the milliseconds. This is helpful for debugging when there may be a number of simultaneously webhooks being sent within the same second.We’re printing the Root Entity and Entity information in a single column.Next, we’re using a Template helper function to calculated the Response Time, and finally, we’re displaying the Retailer Id, which is helpful for differentiating which Retailer context is being used in multi-retailer accounts.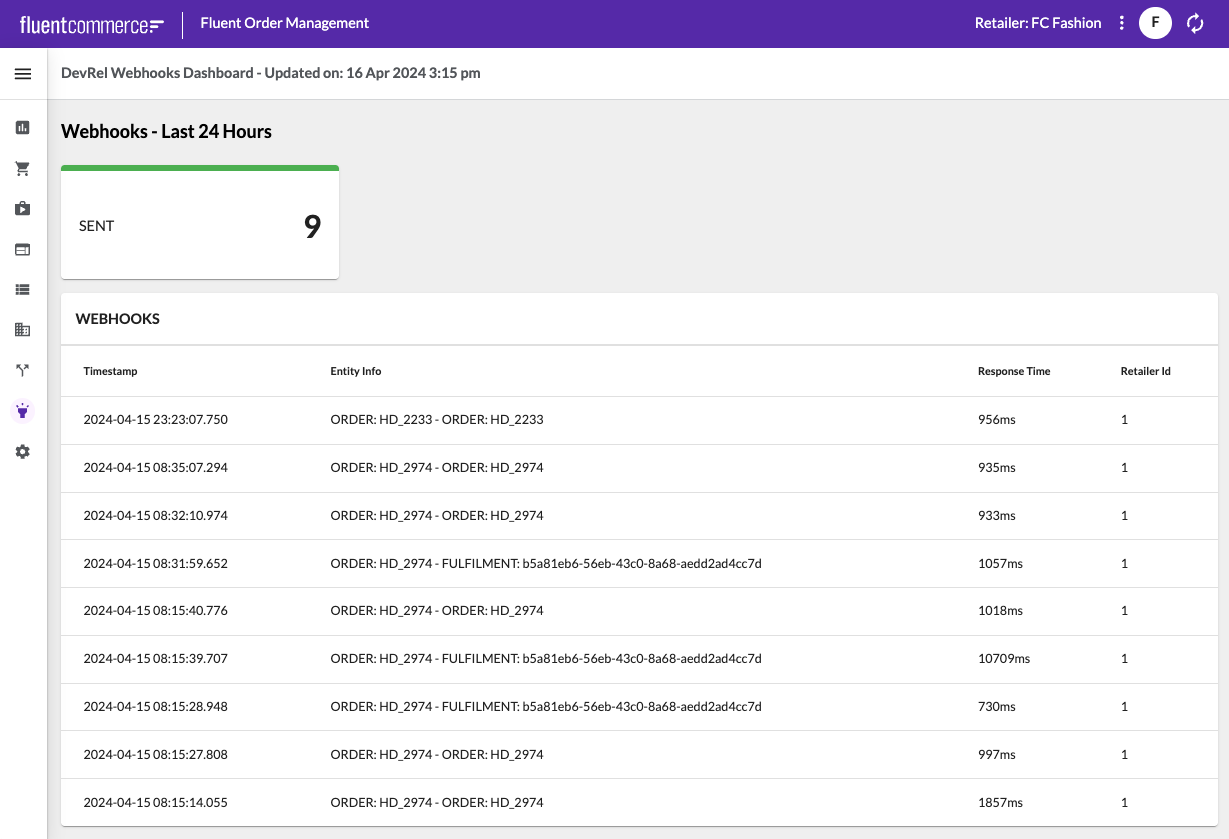 Initial Webhooks list configured with Event Context (Zoom Image)
`byName` accessor to retrieve the attributes we want to display, but first a note about attribute naming. These Webhook Audit events are generated by the Workflow Engine, so we cannot change them. Each of the Webhook-specific Event Attributes have a space in the name, but the `byName` accessor does not support spaces!Thankfully, the Component SDK `decorateQueryResult` function handles this for us, by simply removing any characters that are not alpha-numeric or an underscore. This means that we can still access the specific attributes we want to use with the `byName` accessor by simply removing the spaces:The `devrel.provider.rest` component has already handled calling the `decorateQueryResult` function, so all we need to do is add the columns we want to display to the list definition.Let’s add a column for the endpoint:And then let’s put the Response code and reason in one column like this:The list component configuration should now look like this: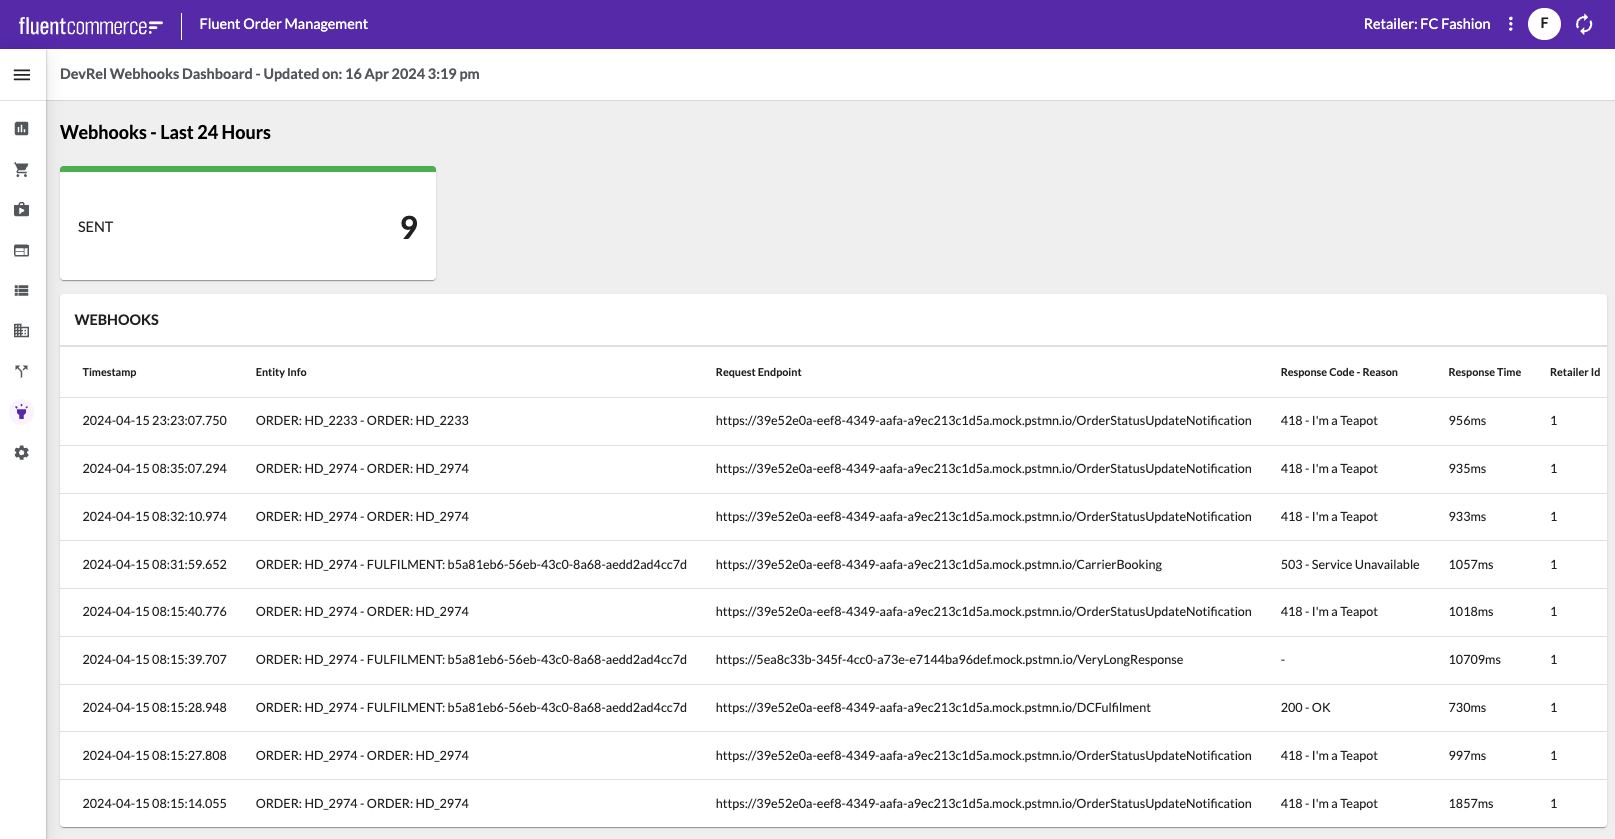 Webhooks List with Webhook specific Attributes (Zoom Link)
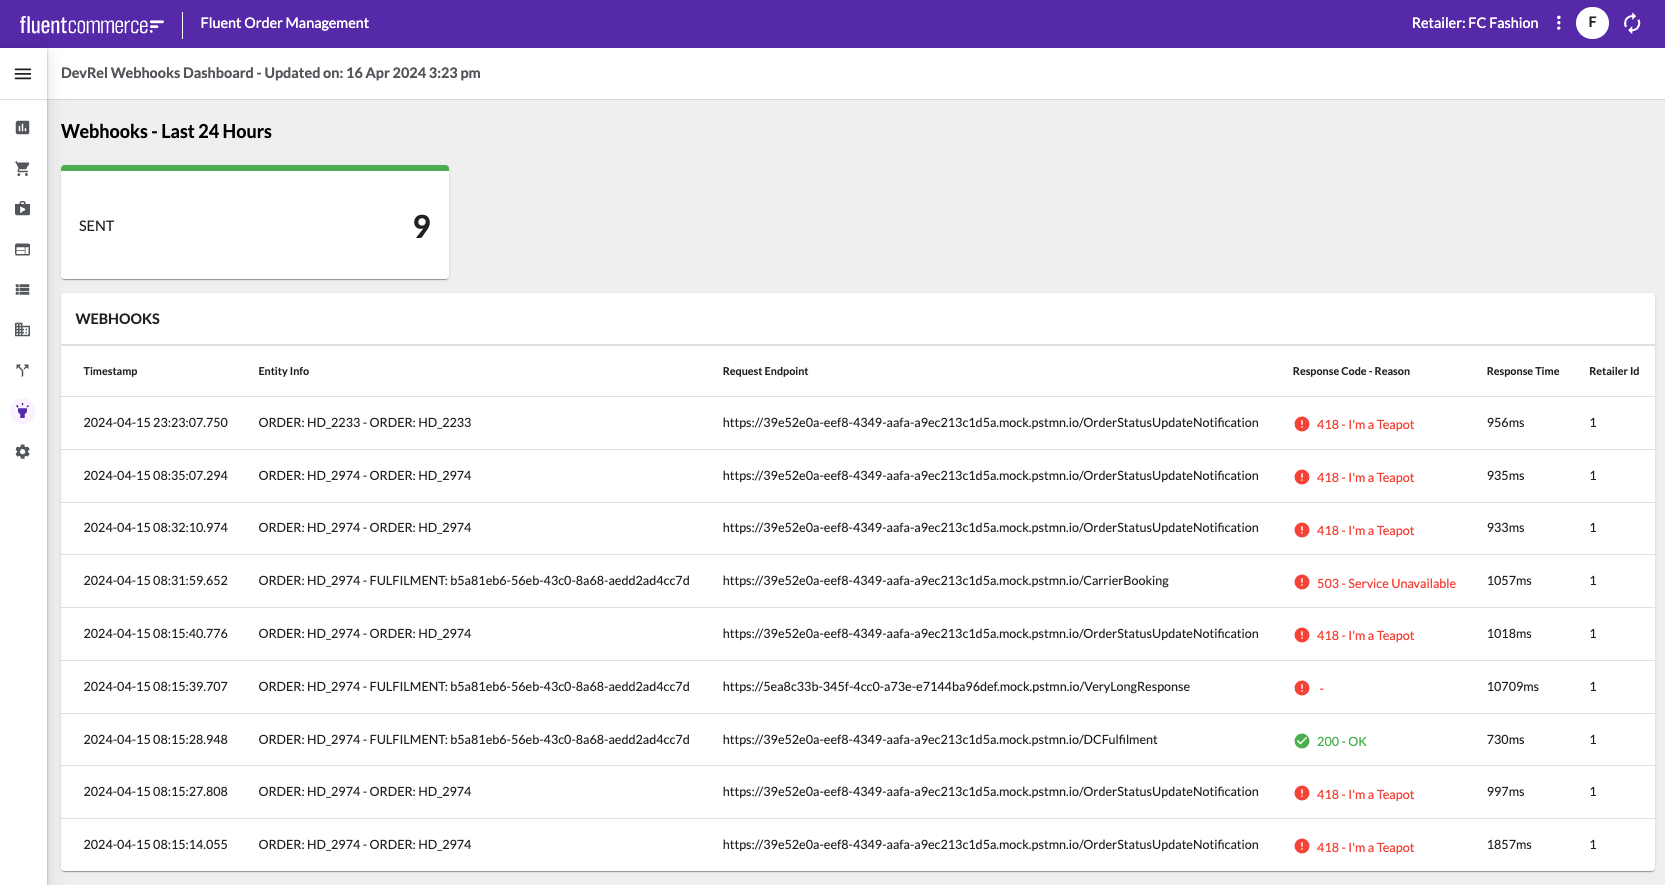 Webhooks List with conditional styling on Response Code - Reason column (Zoom Image)
`fc.drawer.button` which can be added as a column to the list. We can then populate the drawer with any other components to display more details about the specific record.So to complete our Webhooks Dashboard page, let’s use 3 standard attribute cards to display the Request details, Response details, and Exception details in the drawer respectively.Add the following snippet as the last column in the Webhooks list:Here is the result: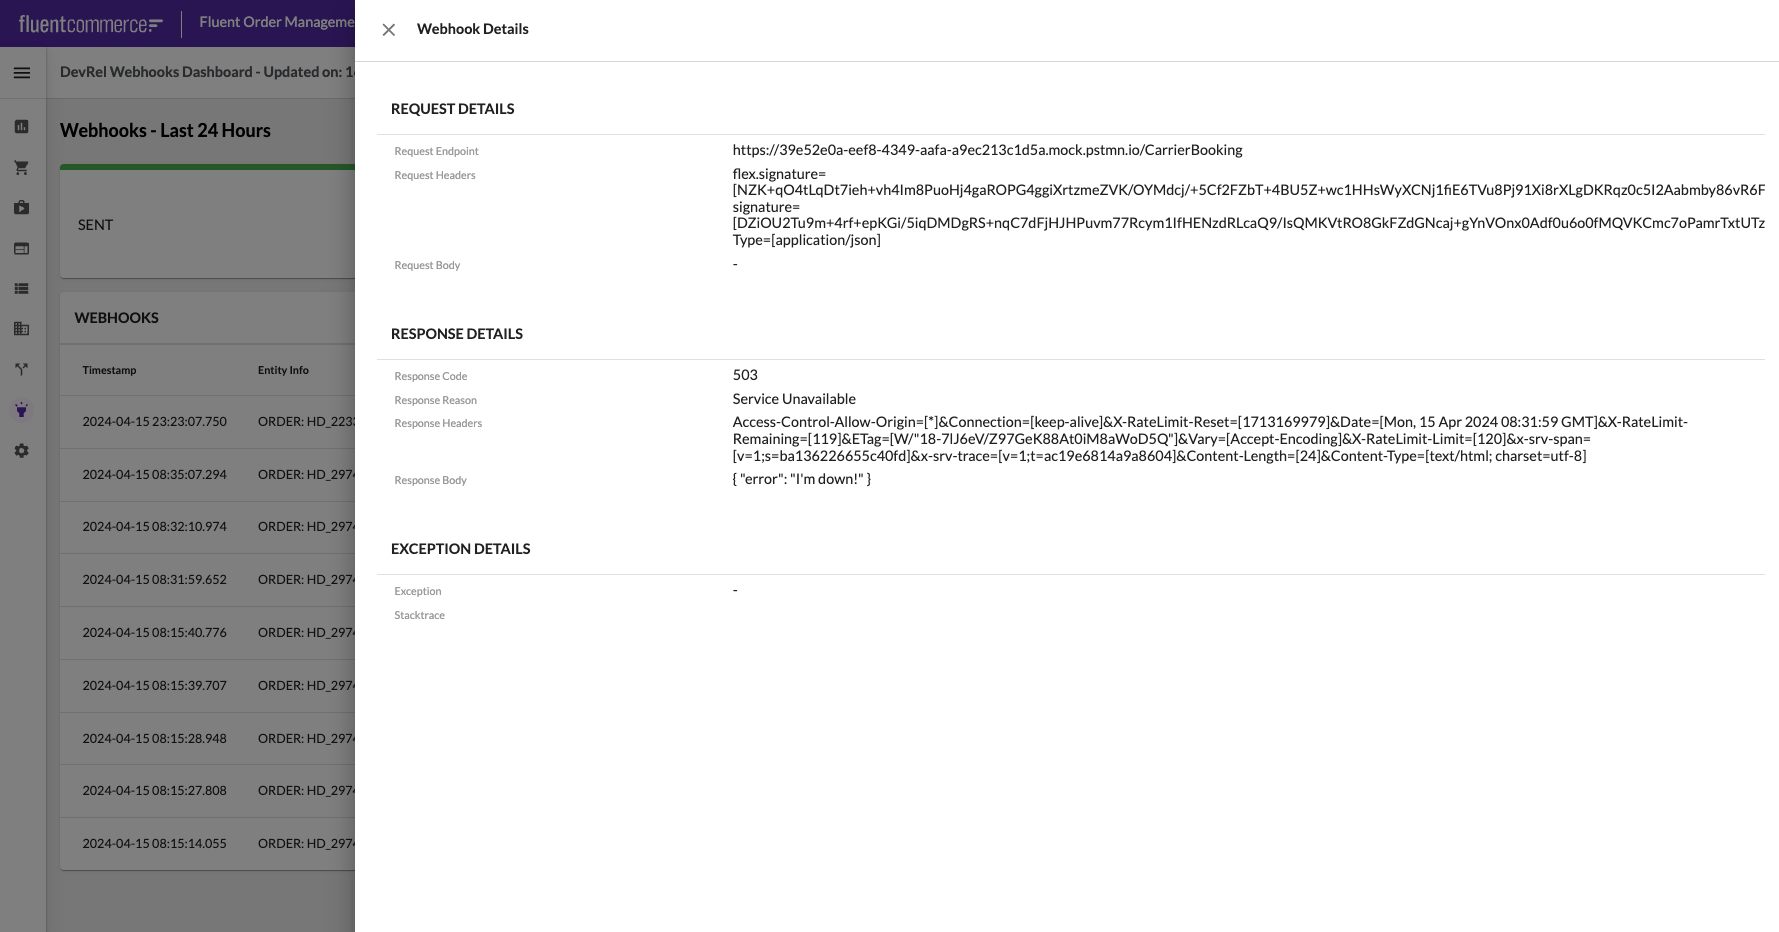 Webhook Details Drawer with 503 Error Response (Zoom Image)
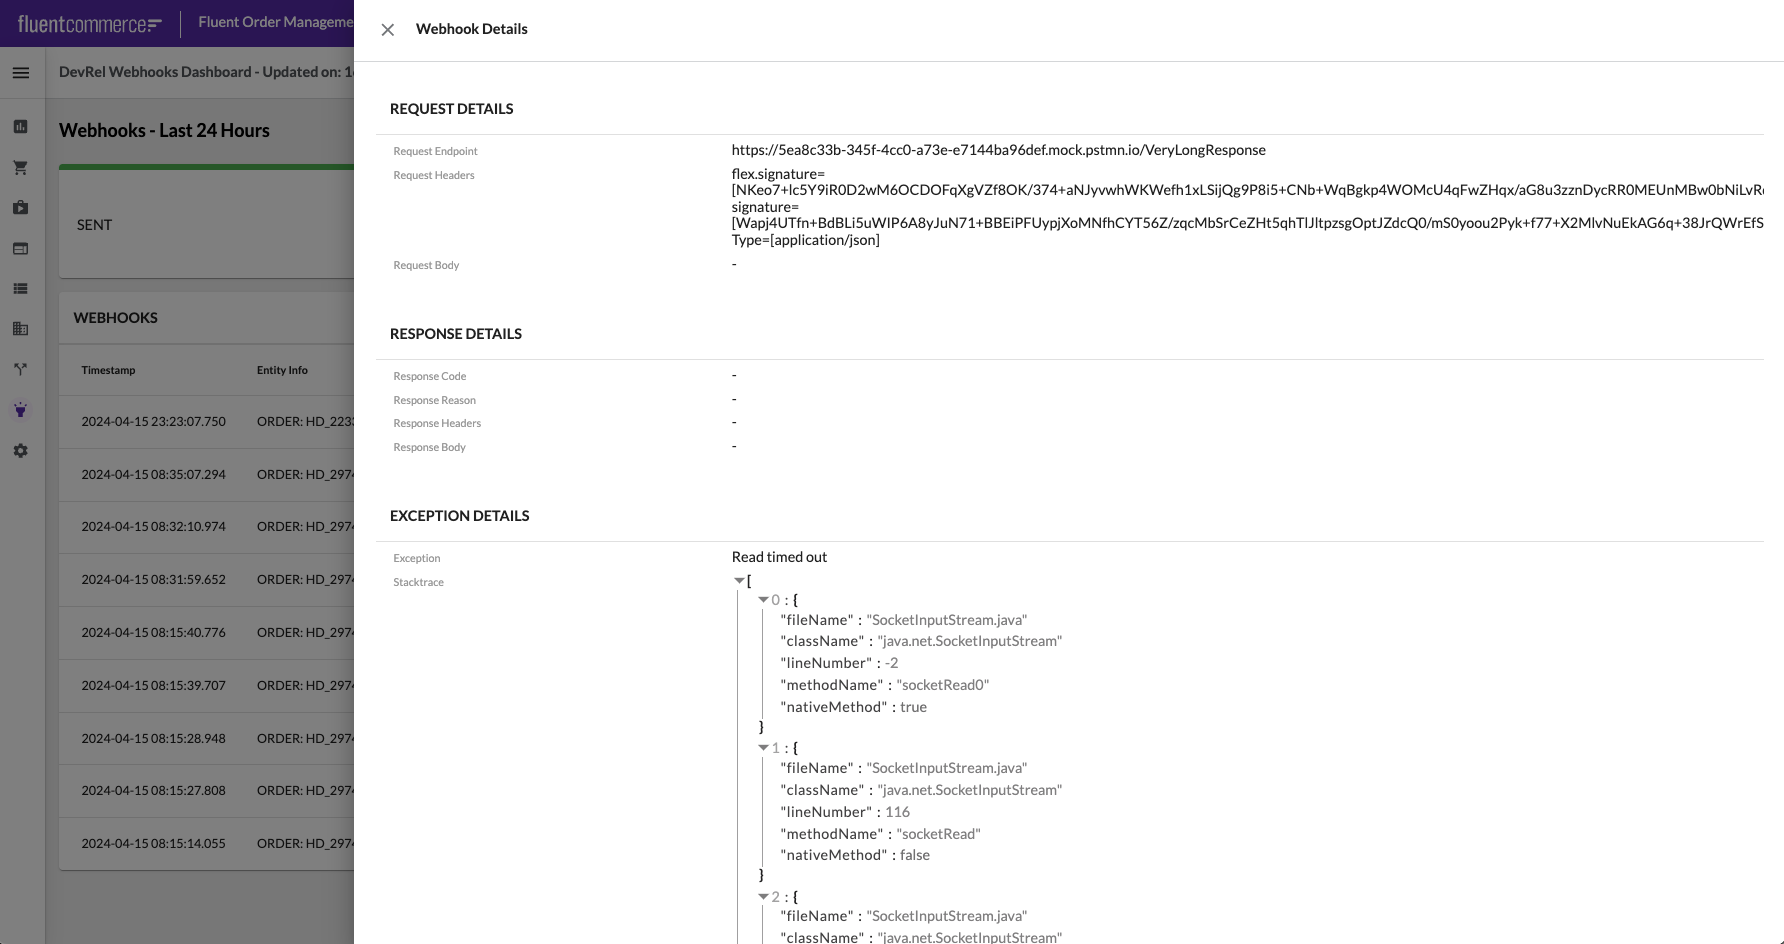 Webhook Details Drawer with Stacktrace Error (Zoom Image)
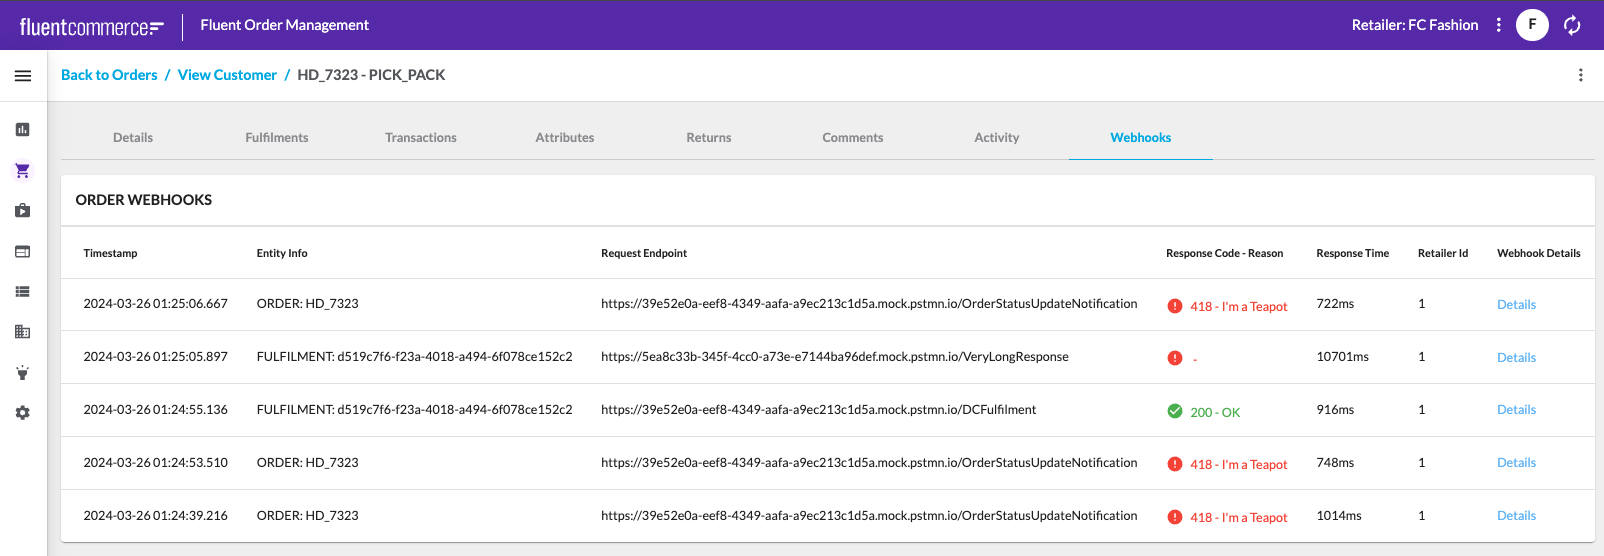 Example of showing Webhook Audit information on the Order Details screen (Zoom Image)
`devrel.provider.rest` component, to narrow the search to a specific scope.`devrel.provider.rest` component to configure a Webhooks Dashboard for monitoring Webhooks sent by your Fluent workflows.There are plenty of other useful things you can do with the `devrel.provider.rest` component, both by tailoring additional Event API queries, or by using data from any of the other Fluent Platform REST APIs.Copyright © 2024-2026 Fluent Retail Pty Ltd (trading as Fluent Commerce). Unless otherwise expressly stated in a current written agreement with Fluent Commerce or any of its affiliates or on any single page of the docs.fluentcommerce.com site, use of the materials on this site is strictly limited to viewing by individuals over 18 years old for legitimate commercially appropriate reasons; and any downloading, copying or other actions or uses of any kind or by any means of the materials on this site, including by artificial intelligence tools, is strictly prohibited. All other rights reserved.
1{
2  "type": "page",
3  "path": "/devrel-webhooks-dashboard",
4  "nav": {
5    "label": "DevRel Webhooks Dashboard",
6    "icon": "MdEvent"
7  },
8  "component": "fc.page",
9  "props": {
10    "title": "DevRel Webhooks Dashboard - Updated on: {{dateStringFormatter (dateAdd)}}"
11  },
12  "descendants": [
13    {
14      "component": "fc.page.section.header",
15      "props": {
16        "title": "Webhooks - Last 24 Hours"
17      }
18    }
19  ]
20}1{
2 "component": "devrel.provider.rest",
3 "props": {
4 "endpoint": "api/v4.1/event",
5 "props": {
6 "name": "Send Webhook",
7 "category": "ACTION",
8 "from": "{{dateStringFormatter (dateSubtract hours=24) 'YYYY-MM-DD[T]HH:mm:ss.SSS[Z]' true}}"
9 }
10 },
11 "descendants": [
12 /* Children */
13 ]
14}1{
2 "component": "fc.dashboard.threshold",
3 "props": {
4 "label": "Sent",
5 "value": "{{results.length}}"
6 }
7}1{
2 "id": "80341b8d-66cc-4619-8e6f-dc458d5a4758",
3 "name": "Send Webhook",
4 "type": "ORCHESTRATION_AUDIT",
5 "accountId": "FCTRAINAU1251",
6 "retailerId": "1",
7 "category": "ACTION",
8 "context": {
9 "sourceEvents": [
10 "a5f02716-eb0f-11ee-946a-dbc474cefc67"
11 ],
12 "entityType": "ORDER",
13 "entityId": "980",
14 "entityRef": "HD_7323",
15 "rootEntityType": "ORDER",
16 "rootEntityId": "980",
17 "rootEntityRef": "HD_7323"
18 },
19 "eventStatus": "SUCCESS",
20 "attributes": [
21 {
22 "name": "Request Endpoint",
23 "value": "https://39e52e0a-eef8-4349-aafa-a9ec213c1d5a.mock.pstmn.io/OrderStatusUpdateNotification",
24 "type": "STRING"
25 },
26 {
27 "name": "Request Headers",
28 "value": "flex.signature=[CahPe2zhT/jNCHuIW0urQyWCNXogdcEQQPdMD6bvD5I4CQHAQbqRWRgyzJaLtPYANVodGrtgiTcS0/0PJb5jLxuRDuXrWrBVRTmHqQ8iFIIYnKNgwm2utjLWIuK3aBnz7hhIugdgMjEKLsakeIT5n+3fOttV1n/f2nQomxXokJs=]&fluent-signature=[Owv+GbBHMGt2txPtmzOAT7xfudvg5bgZsRlUV0aDTCLFmNrxDPZKejE1rWKbW7FCJ8FNrAeO5/6tnpFLQJWg6ggCAo+9DfguSoJ8sgP25JvlJgcp4P5I+qzxHVTQdvIJ33NKT7Xei1PDFgZdH6IA9P6C3hnztzRgvX0qxnaFcVQ=]&Content-Type=[application/json]",
29 "type": "STRING"
30 },
31 {
32 "name": "Response Body",
33 "value": "{ \"message\": \"Notify: I'm a Tea Pot\" }",
34 "type": "STRING"
35 },
36 {
37 "name": "Response Headers",
38 "value": "Access-Control-Allow-Origin=[*]&Connection=[keep-alive]&X-RateLimit-Reset=[1711416354]&Date=[Tue, 26 Mar 2024 01:25:06 GMT]&X-RateLimit-Remaining=[117]&ETag=[W/\"26-b/Z+NSe+HrEYTJHVYWLGXtxbT5I\"]&Vary=[Accept-Encoding]&X-RateLimit-Limit=[120]&x-srv-span=[v=1;s=893426db16f1d71d]&x-srv-trace=[v=1;t=542a937ae712a09a]&Content-Length=[38]&Content-Type=[text/html; charset=utf-8]",
39 "type": "STRING"
40 },
41 {
42 "name": "Response code",
43 "value": 418,
44 "type": "INTEGER"
45 },
46 {
47 "name": "Response reason",
48 "value": "I'm a Teapot",
49 "type": "STRING"
50 },
51 {
52 "name": "startTimer",
53 "value": 1711416305945,
54 "type": "STRING"
55 },
56 {
57 "name": "stopTimer",
58 "value": 1711416306667,
59 "type": "STRING"
60 }
61 ],
62 "source": "-626199502.FulfilmentAssigned",
63 "generatedBy": "Rubix User",
64 "generatedOn": "2024-03-26T01:25:06.667+00:00"
65}1{
2 "component": "fc.list",
3 "props": {
4 "title": "Webhooks",
5 "dataSource": "results",
6 "responsiveness": "card",
7 "attributes": [
8 {
9 "label": "Timestamp",
10 "value": "{{dateStringFormatter generatedOn 'YYYY-MM-DD HH:mm:ss.SSS' true}}"
11 },
12 {
13 "label": "Entity Info",
14 "value": "{{context.rootEntityType}}: {{context.rootEntityRef}} - {{context.entityType}}: {{context.entityRef}}"
15 },
16 {
17 "label": "Response Time",
18 "value": "{{subtract attributes.byName.stopTimer attributes.byName.startTimer}}ms"
19 },
20 {
21 "label": "Retailer Id",
22 "value": "{{retailerId}}"
23 }
24 ]
25 }
26}1// To access an attribute with a space in the name using the 'byName' accessor,
2// simply remove the space.
3
4// For example: For an attribute named 'Request Endpoint':
5
6{{attributes.byName.ResponseEndpoint}}1{
2 "label": "Request Endpoint",
3 "value": "{{attributes.byName.RequestEndpoint}}"
4}1{
2 "label": "Response Code - Reason",
3 "template": "{{attributes.byName.Responsecode}} - {{attributes.byName.Responsereason}}"
4}1{
2 "component": "fc.list",
3 "props": {
4 "title": "Webhooks",
5 "dataSource": "results",
6 "responsiveness": "card",
7 "attributes": [
8 {
9 "label": "Timestamp",
10 "value": "{{dateStringFormatter generatedOn 'YYYY-MM-DD HH:mm:ss.SSS' true}}"
11 },
12 {
13 "label": "Entity Info",
14 "value": "{{context.rootEntityType}}: {{context.rootEntityRef}} - {{context.entityType}}: {{context.entityRef}}"
15 },
16 {
17 "label": "Request Endpoint",
18 "value": "{{attributes.byName.RequestEndpoint}}"
19 },
20 {
21 "label": "Response Code - Reason",
22 "template": "{{attributes.byName.Responsecode}} - {{attributes.byName.Responsereason}}"
23 },
24 {
25 "label": "Response Time",
26 "value": "{{subtract attributes.byName.stopTimer attributes.byName.startTimer}}ms"
27 },
28 {
29 "label": "Retailer Id",
30 "value": "{{retailerId}}"
31 }
32 ]
33 }
34}1"options": {
2 "styles": [
3 {
4 "value": "{{attributes.byName.Responsecode}}",
5 "matches": ["200", "202", "204"],
6 "icon": { "name": "MdCheckCircle", "colour": "success" },
7 "text": { "color": "success" }
8 },
9 {
10 "value": "{{attributes.byName.Responsecode}}",
11 "icon": { "name": "MdError", "colour": "error" },
12 "text": { "color": "error" }
13 }
14 ]
15}1{
2 "label": "Webhook Details",
3 "type": "component",
4 "options": {
5 "component": "fc.drawer.button",
6 "props": {
7 "label": "Details",
8 "title": "Webhook Details",
9 "descendants": [
10 {
11 "component": "fc.card.attribute",
12 "props": {
13 "title": "Request Details",
14 "attributes": [
15 {
16 "label": "Request Endpoint",
17 "value": "{{attributes.byName.RequestEndpoint}}"
18 },
19 {
20 "label": "Request Headers",
21 "value": "{{attributes.byName.RequestHeaders}}"
22 },
23 {
24 "label": "Request Body",
25 "value": "{{attributes.byName.RequestBody}}"
26 }
27 ]
28 }
29 },
30 {
31 "component": "fc.card.attribute",
32 "props": {
33 "title": "Response Details",
34 "attributes": [
35 {
36 "label": "Response Code",
37 "value": "{{attributes.byName.Responsecode}}"
38 },
39 {
40 "label": "Response Reason",
41 "value": "{{attributes.byName.Responsereason}}"
42 },
43 {
44 "label": "Response Headers",
45 "value": "{{attributes.byName.ResponseHeaders}}"
46 },
47 {
48 "label": "Response Body",
49 "value": "{{attributes.byName.ResponseBody}}"
50 }
51 ]
52 }
53 },
54 {
55 "component": "fc.card.attribute",
56 "props": {
57 "title": "Exception Details",
58 "attributes": [
59 {
60 "label": "Exception",
61 "value": "{{attributes.byName.Exception}}"
62 },
63 {
64 "label": "Stacktrace",
65 "type": "component",
66 "options": {
67 "component": "fc.attribute.json",
68 "dataSource": "attributes.byName.Stacktrace"
69 }
70 }
71 ]
72 }
73 }
74 ]
75 }
76 }
77}