Build a Webhooks Monitoring Dashboard
How-to Guide
Extend
Author:
Lesley Dean
Changed on:
5 Sept 2025
Key Points
- For Frontend Configurators (JSON) of the Fluent OMX UX Framework with access to a small custom component
- Enable a visual Webhooks Monitoring Dashboard in the Fluent OMS (or any other Fluent web app)
- How to add a new page to the Insights section
- How to query the Event API for Webhook Audit Events
- How to use the
`devrel.provider.rest`component to display information from the Fluent REST APIs using standard the standard UX Component Library - Access specific attributes by name (even when they contain spaces!)
- How to conditionally color code a specific table column
- How to display a details drawer from a list
- How to display contextual Webhook information on the Order Details screen
Prerequisites
Steps
Introduction
 Overview
Monitoring any key business system is key to ensuring the optimal and smooth running of the business itself.Connecting many different systems is a fundamental need for order management systems, which are part of an enterprise architecture. If communication between these systems breaks down, this can cause costly impacts, such as delays in fulfilling customer orders, inaccurate data across systems, and more.The Fluent OMX Workflow Framework supports Webhooks, which are sent via a Rule in a Workflow and tracked within the Orchestration Audit Events.What if we could provide Support & Operations personnel with the observability of these Webhooks quickly inside a Fluent OMX web app?This article will guide you through configuring a Webhooks Dashboard inside the Fluent OMS web app.
Problem Statement & Scenario
Problem Statement
Webhooks are used to send information from Fluent products to external systems. These are implemented using the
`SendWebhook` Rule from the Core Module in a Workflow.Every Webhook action produced is logged in the Orchestration Audit Events, accessible via the Events screen in the Fluent OMS web app or through the Event API.Webhooks are often an important part of an entity's lifecycle, and as such, it is important to monitor Webhooks sent by the Fluent Platform regularly to ensure that no issues occur and cause significant delays in fulfilling your customer's orders.While you could use Events screen in the Fluent OMS web app, or even add a new page using the default `fc.events.search` component with preconfigured filters, this doesn’t provide the most relevant information in the list specific to Webhooks.Scenario
Ideally, we configure a new Webhooks Dashboard that displays only relevant Webhook information, making it quick and simple to see if everything is working as expected.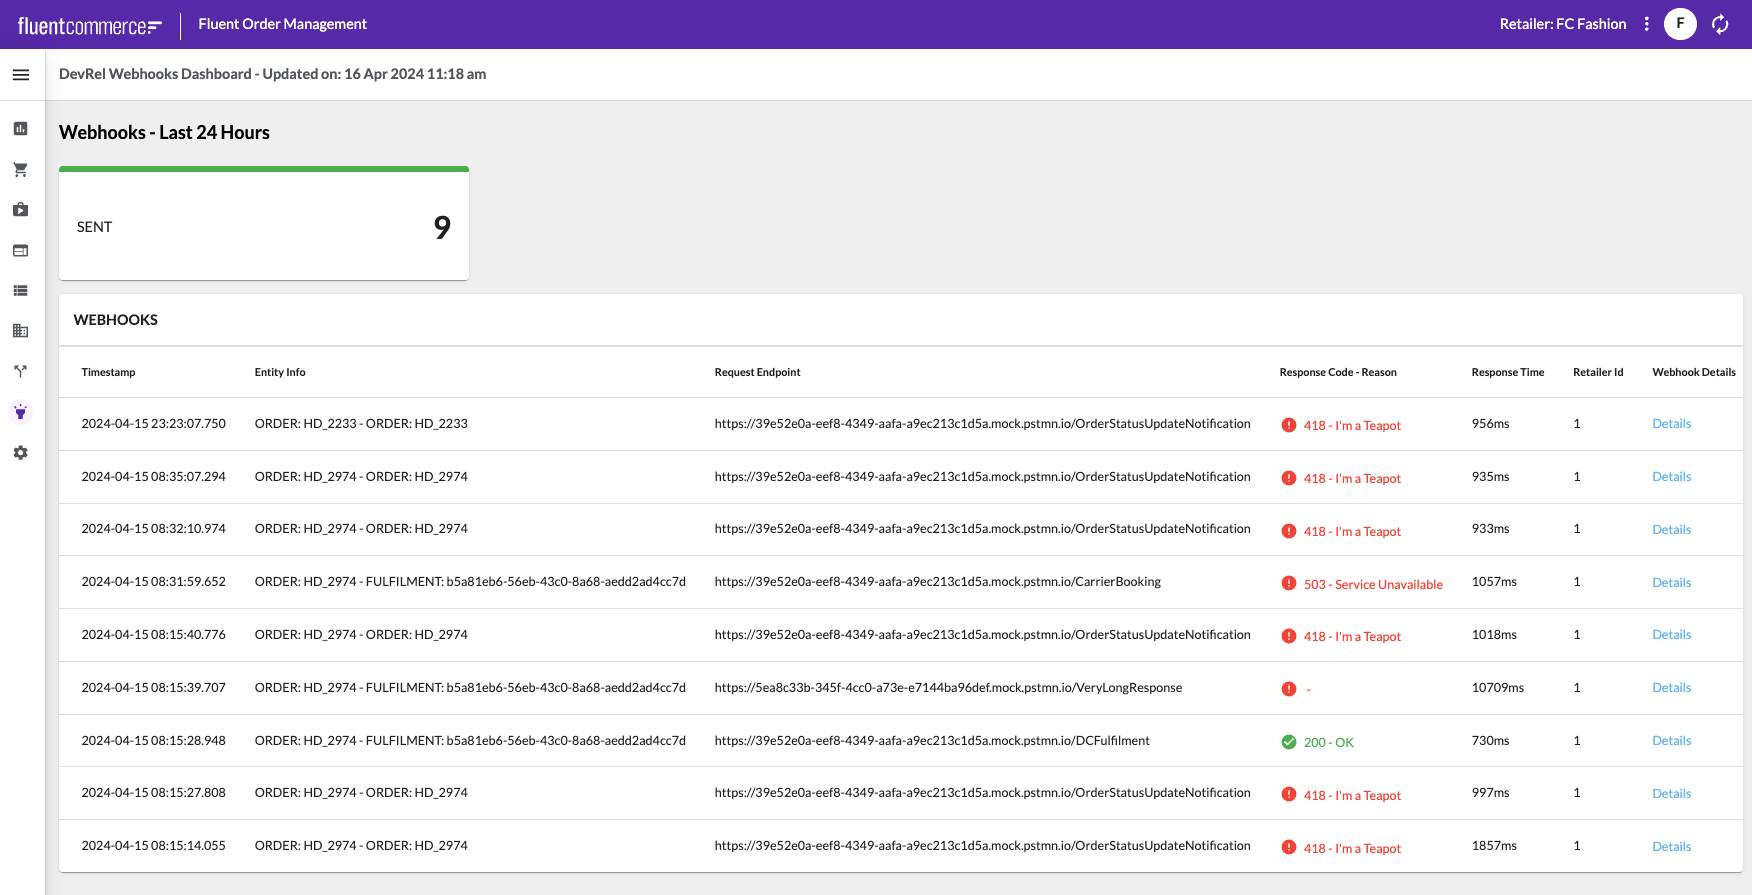 A Webhooks Dashboard for monitoring Webhooks in Fluent OMS (Zoom Image)
A Webhooks Dashboard for monitoring Webhooks in Fluent OMS (Zoom Image)Solution
Approach
Since Webhook audit information is available through the Event API, we need to be able to query the Webhook Orchestration Audit Events and present them on the screen.In a previous article, we implemented a handy custom component that can make REST API calls and provide the results to the data property of any child components.Let’s use this to configure a new Webhooks Dashboard.
Implementation Steps
Step 1: Add a new Page to the Insights section on Fluent OMS
Let’s use the existing Insights section in the Fluent OMS web app, and add a new page to build our Webhooks Dashboard.Inside the
`fc.manifest.fragment.oms.insights.json` file, add the following snippet to the `pages` array on the section route:The snippet above defines a new page on path `devrel-webhooks-dashboard`, using the standard `fc.page` component.Additionally, it sets the `nav` details for display in the left navigation menu, sets the page title, and added a simple section header descendant (child component).Step 2: Configure the `devrel.provider.rest` component to query for Webhook Audit Events
We’ll use a custom provider component to query the Event API for Webhook Action Audit Events.Inside the
`descendants` array of the `fc.page` component, beneath the section header, add the following snippet:In this snippet, we’ve configured the `devrel.provider.rest` component to call the Fluent Event API, and see the filter criteria via the `props` object.To retrieve the Audit events for Webhooks, we query the Event API for Events with a name of “Send Webhook”, and a category of “ACTION”. Additionally, we’ll query the last 24 hours by setting the `from` parameter to a relative timestamp from now.Step 3: Add Child Components to display the Webhook information
Let’s start with something simple, and display a Dashboard Threshold tile to display the total number of Webhooks sent in the last 24 hours.Add the following snippet to the descendants of the  A Standard Dashboard Threshold Tile Component showing the total Webhooks sent in the last 24 hours
Now, let’s make it more interesting, and add a list. Since we are displaying Webhook Action events only, we can configure this list to display the standard Webhook Event Attributes, which gives us access to details about the Webhook Request, Response, and any Exceptions that may have occurred.Here is an example of a Webhook Action Audit Event:There is lots of useful information here. As with any Orchestration Audit Event, we can see the Retailer Id, the Entity information, which tells use which specific entity the Webhook was for, the timestamp of when the event was generated, and the start and stop timer Event Attributes which tell us how long the Action ran for. We can use the latter 2 attributes to display the duration of time that the webhook request took to execute.We also see the Webhook specific Request and Response Event attributes. Let’s first add the basic context fields to a list:Notice how we’re formatting the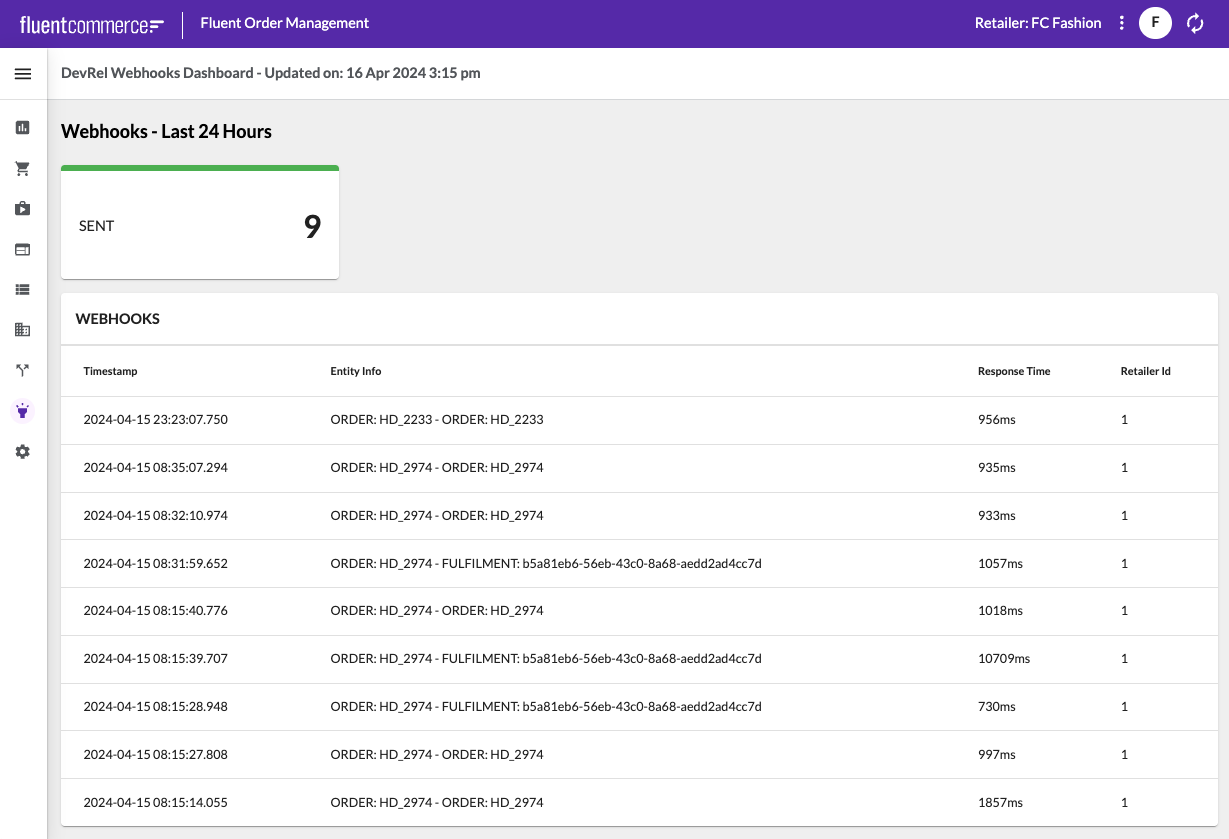 Initial Webhooks list configured with Event Context (Zoom Image)
`devrel.provider.rest` component declaration:To display the count, we simply set the value to the results array length.A Standard Dashboard Threshold Tile Component showing the total Webhooks sent in the last 24 hoursNow, let’s make it more interesting, and add a list. Since we are displaying Webhook Action events only, we can configure this list to display the standard Webhook Event Attributes, which gives us access to details about the Webhook Request, Response, and any Exceptions that may have occurred.Here is an example of a Webhook Action Audit Event:There is lots of useful information here. As with any Orchestration Audit Event, we can see the Retailer Id, the Entity information, which tells use which specific entity the Webhook was for, the timestamp of when the event was generated, and the start and stop timer Event Attributes which tell us how long the Action ran for. We can use the latter 2 attributes to display the duration of time that the webhook request took to execute.We also see the Webhook specific Request and Response Event attributes. Let’s first add the basic context fields to a list:Notice how we’re formatting the
`generatedOn` field, including the milliseconds. This is helpful for debugging when there may be a number of simultaneously webhooks being sent within the same second.We’re printing the Root Entity and Entity information in a single column.Next, we’re using a Template helper function to calculated the Response Time, and finally, we’re displaying the Retailer Id, which is helpful for differentiating which Retailer context is being used in multi-retailer accounts.Initial Webhooks list configured with Event Context (Zoom Image)Step 4: Add Webhook specific Attributes to the List
Now let’s add some of the Webhook specific attributes to display in the list. The most useful attributes to display in the list might be “Request Endpoint”, the “Response code”, and the “Response reason“. We can use the 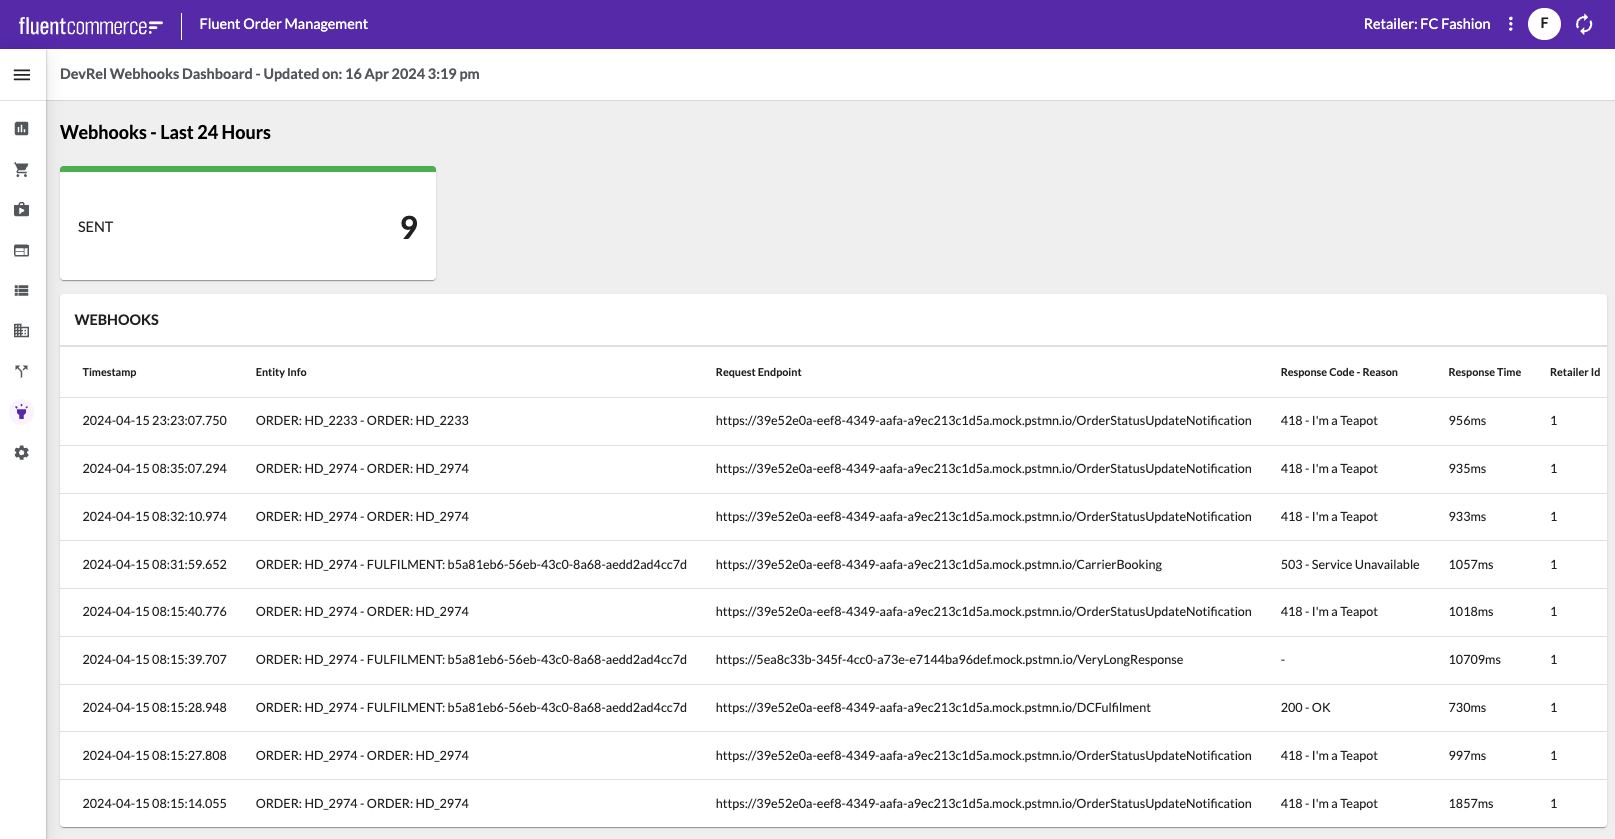 Webhooks List with Webhook specific Attributes (Zoom Link)
`byName` accessor to retrieve the attributes we want to display, but first a note about attribute naming. These Webhook Audit events are generated by the Workflow Engine, so we cannot change them. Each of the Webhook-specific Event Attributes have a space in the name, but the `byName` accessor does not support spaces!Thankfully, the Component SDK `decorateQueryResult` function handles this for us, by simply removing any characters that are not alpha-numeric or an underscore. This means that we can still access the specific attributes we want to use with the `byName` accessor by simply removing the spaces:The `devrel.provider.rest` component has already handled calling the `decorateQueryResult` function, so all we need to do is add the columns we want to display to the list definition.Let’s add a column for the endpoint:And then let’s put the Response code and reason in one column like this:The list component configuration should now look like this:Webhooks List with Webhook specific Attributes (Zoom Link)Step 5: Add some Styles to the Response Code and Reason
Our list is now displaying some valuable information about the webhooks that have occurred in the last 24 hours. This is great… but we could make it even easier to identify problems by using some styling on the Response Code - Reason column.To do this, we can use the options object of the list attribute and use the styles array to set conditional styling based on the values of the Response code.Each style declaration can take a value and a matches property, which allows us to configure the conditions. Now instead of setting a style for each and every error response, we can make the default colour red, and just add a matches for the success response codes (200, 202, and 204).Notice that we can use the standard Material Icons by prefixing with the “Md” and then the icon name. You can search Material Symbols and Icons available here. This makes it really easy to see the errors stand out at a glance: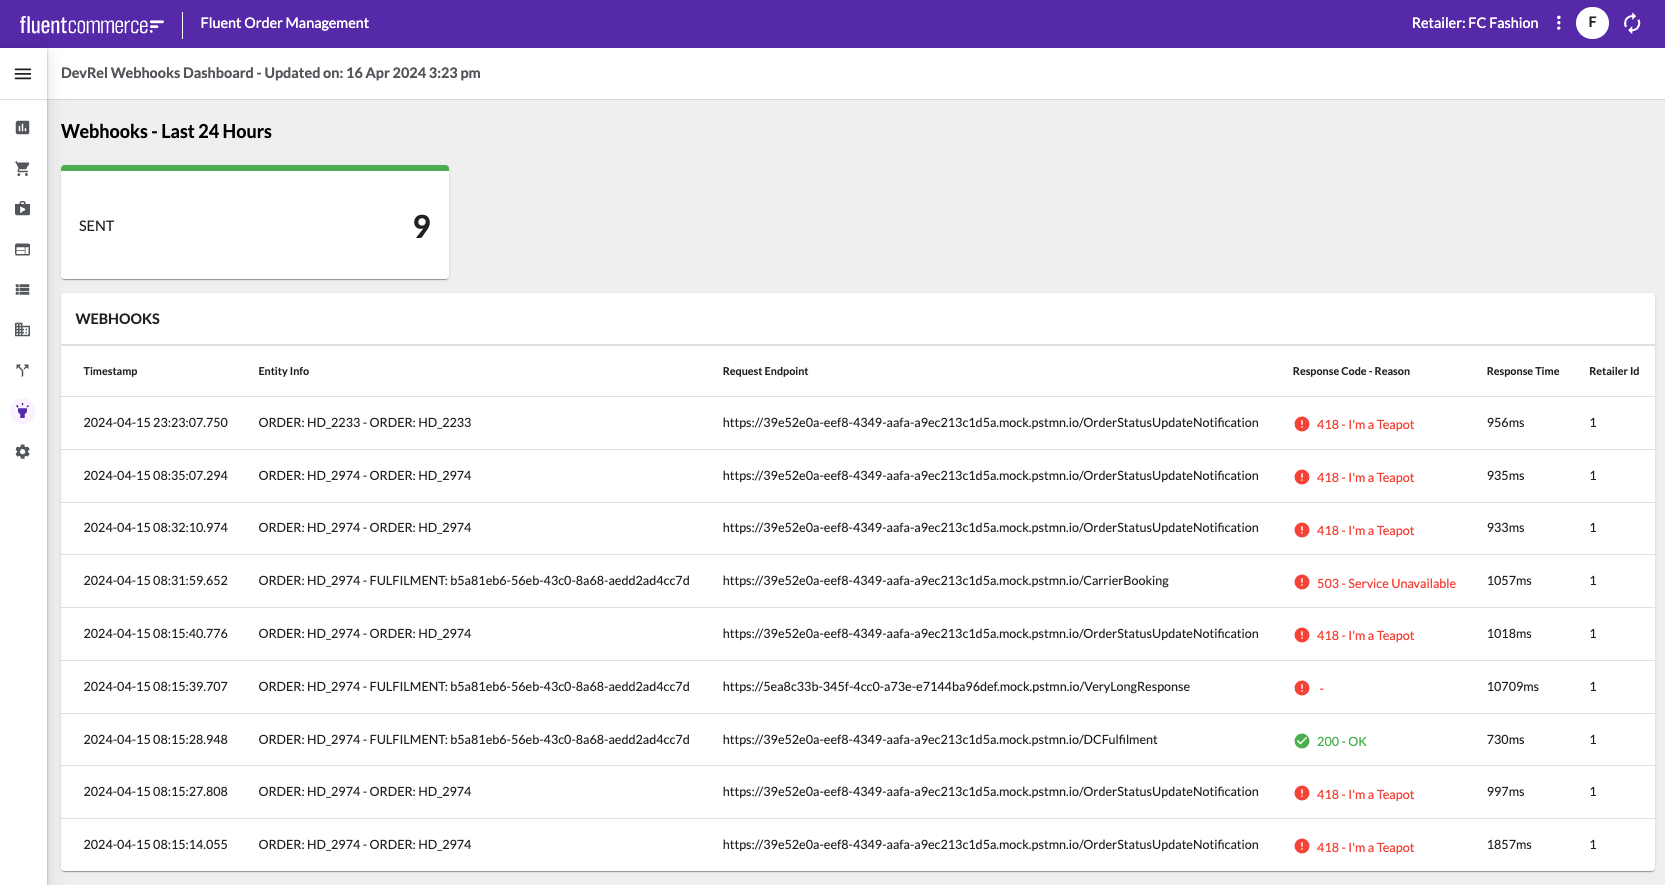 Webhooks List with conditional styling on Response Code - Reason column (Zoom Image)
Webhooks List with conditional styling on Response Code - Reason column (Zoom Image)Step 6: Add a Webhook Details Drawer
When there are errors, it is useful to be able to see more information quickly. To handle this, let’s add a right drawer component to show more details from the Webhook Action event.The Component Library comes with a 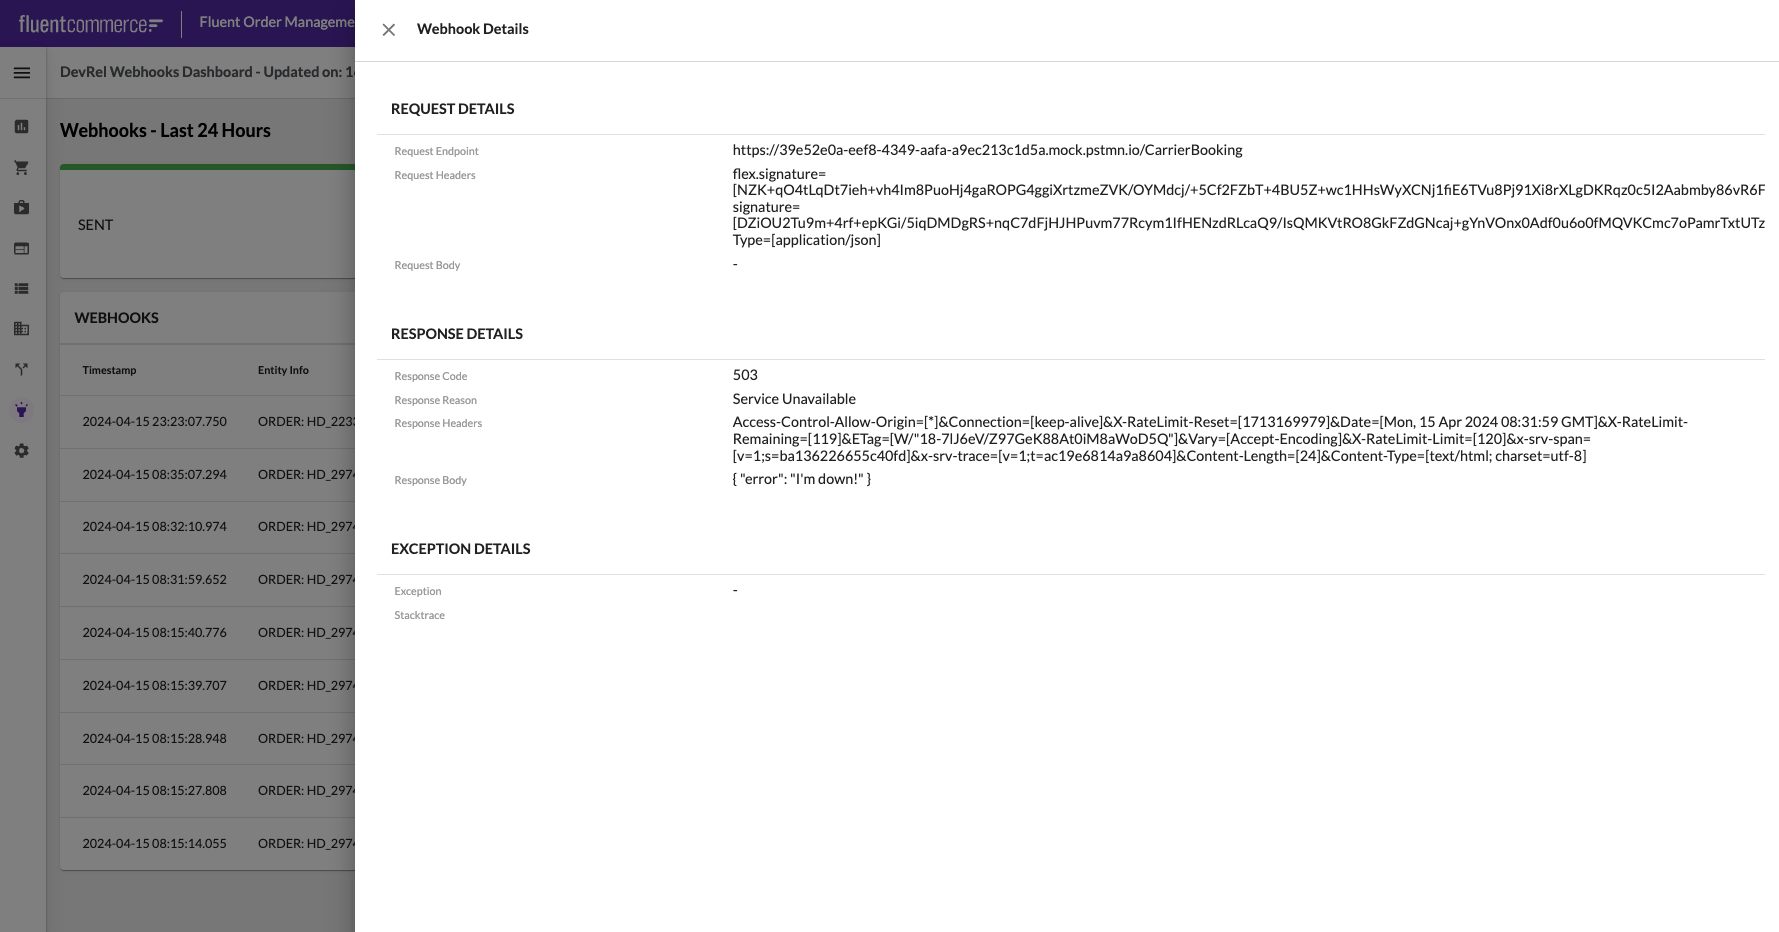 Webhook Details Drawer with 503 Error Response (Zoom Image)
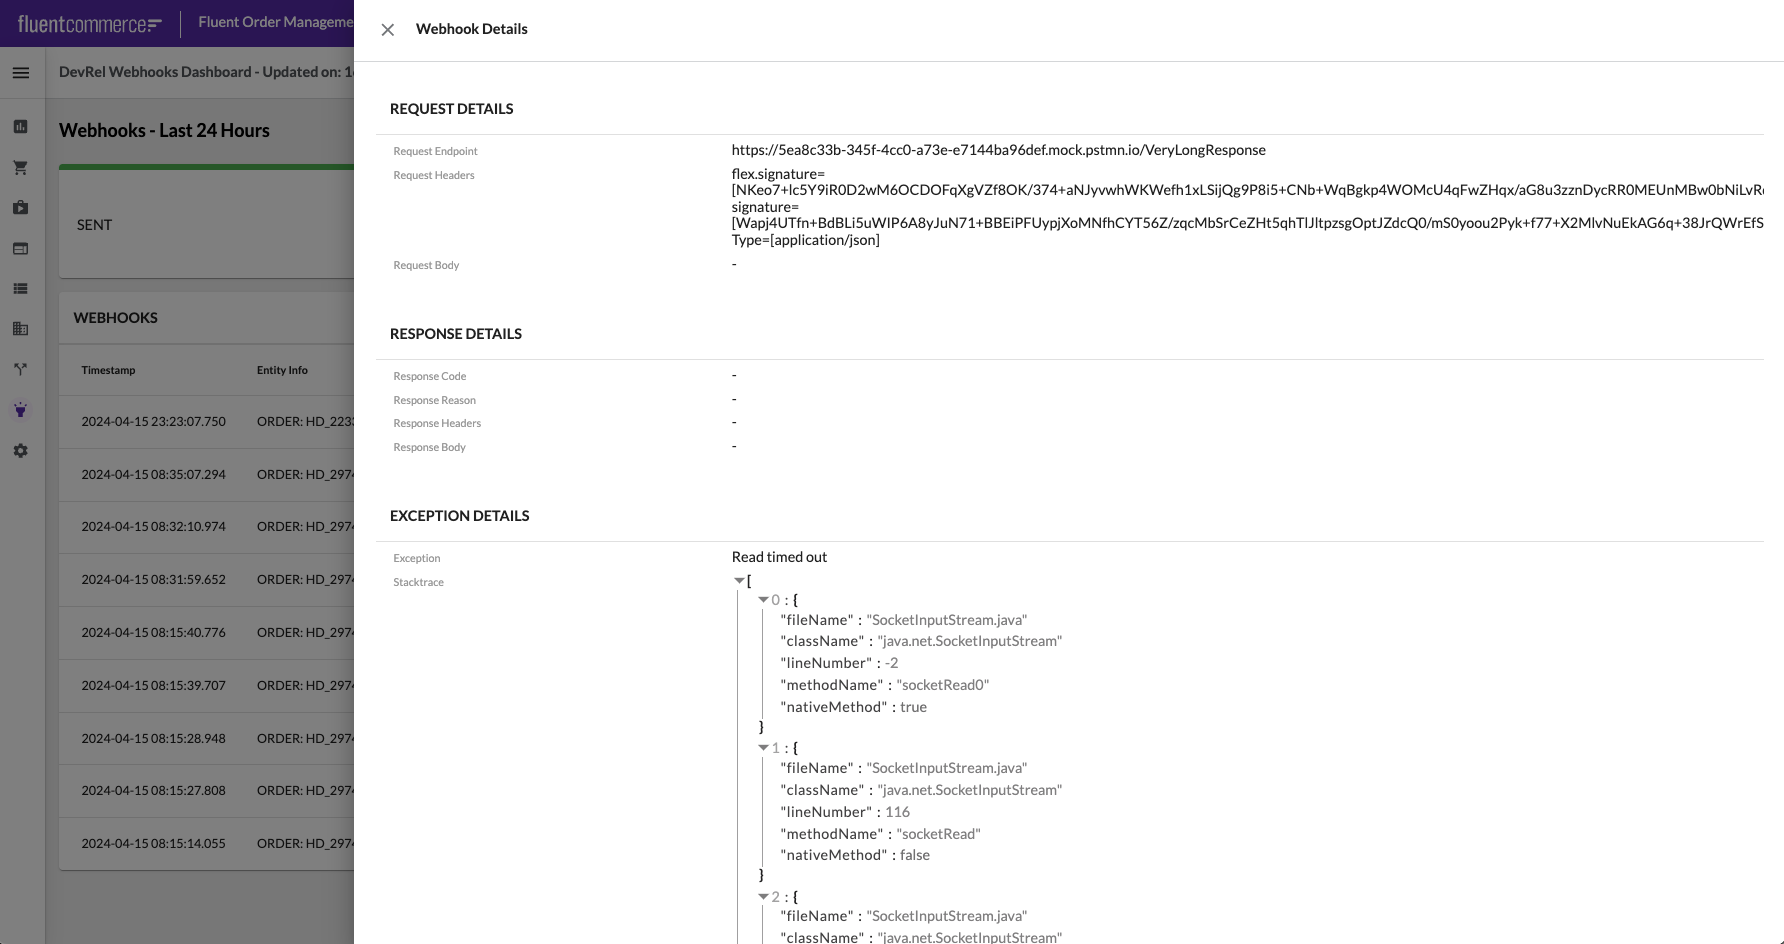 Webhook Details Drawer with Stacktrace Error (Zoom Image)
`fc.drawer.button` which can be added as a column to the list. We can then populate the drawer with any other components to display more details about the specific record.So to complete our Webhooks Dashboard page, let’s use 3 standard attribute cards to display the Request details, Response details, and Exception details in the drawer respectively.Add the following snippet as the last column in the Webhooks list:Here is the result:Webhook Details Drawer with 503 Error Response (Zoom Image)Webhook Details Drawer with Stacktrace Error (Zoom Image)What else can you do?
The Art of the Possible...
This tutorial will end here, but there are many more things you can do should you need to: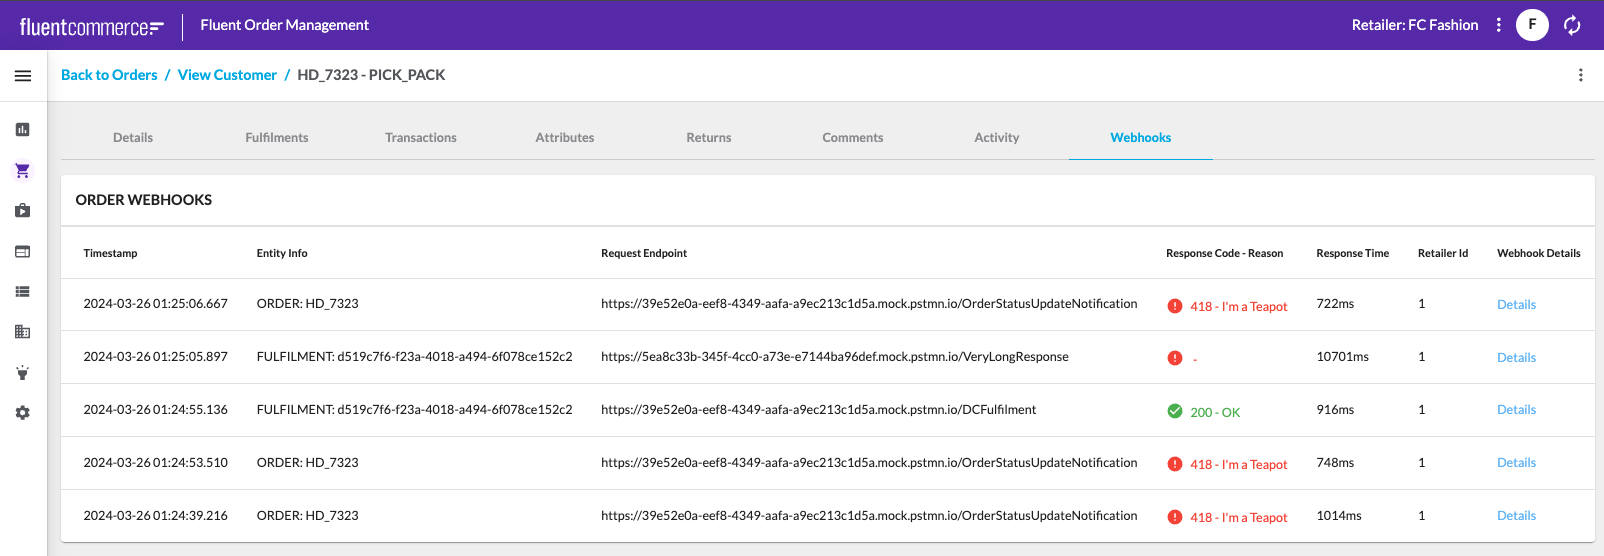 Example of showing Webhook Audit information on the Order Details screen (Zoom Image)
You could follow this through to sub-entities too, such as fulfilments, articles, consignments, etc. Each time, you simply refine the query parameters to be passed to the Event API query in the
- Split the Root Entity and Entity columns, and hyperlink them to enable quick access to the entity detail screen
- You could hyperlink the Request Endpoint, but this is rarely useful, since most webhook endpoints should be configured to receive POST HTTP methods
- You could also enhance the Webhooks page to support additional time ranges
Example of showing Webhook Audit information on the Order Details screen (Zoom Image)You could follow this through to sub-entities too, such as fulfilments, articles, consignments, etc. Each time, you simply refine the query parameters to be passed to the Event API query in the
`devrel.provider.rest` component, to narrow the search to a specific scope.Conclusion
Wrapping up
In this article, you learned how to use the
`devrel.provider.rest` component to configure a Webhooks Dashboard for monitoring Webhooks sent by your Fluent workflows.There are plenty of other useful things you can do with the `devrel.provider.rest` component, both by tailoring additional Event API queries, or by using data from any of the other Fluent Platform REST APIs.Related content
Except as otherwise stated in the Extend Knowledge Content site policy, the content on this page is licensed under the Creative Commons Attribution 4.0 Licence, and any code samples that appear on this page are licensed under the Apache 2.0 Licence, unless any code sample forms part of the Fluent Order Management Platform code. Neither of these licences apply to any content on any other page that can be reached via a link on this page unless otherwise specified on that other page. If you wish to use any of the Extend Knowledge Content, you must do so in compliance with the licenses referred to above and the Extend Knowledge Content site policy, including attribution in the manner set out on this page.