Sources Dashboard
Author:
Fluent Commerce
Changed on:
3 Mar 2025
Overview
The Sources Dashboard allows customers to understand the current state of Inventory Ingestion within their account. Customers can understand how their inventory is processed and monitor the execution flow in real time.
The Sources Dashboard visualizes inventory metrics and displays user-friendly information by querying inventory-related metrics data.
The data is presented for up to the last 24 hours. You can read more about how to configure periods in the guide.
The Sources Dashboard contains Overview and Sources sections.
Key points
- The Sources Dashboard offers a real-time window into Inventory Ingestion, allowing customers to monitor the execution flow and comprehend the current status of their inventory.
- With user-friendly visualizations and configurable time periods, the Sources Dashboard empowers users to access comprehensive inventory metrics data, enhancing their ability to make informed decisions about inventory processing.
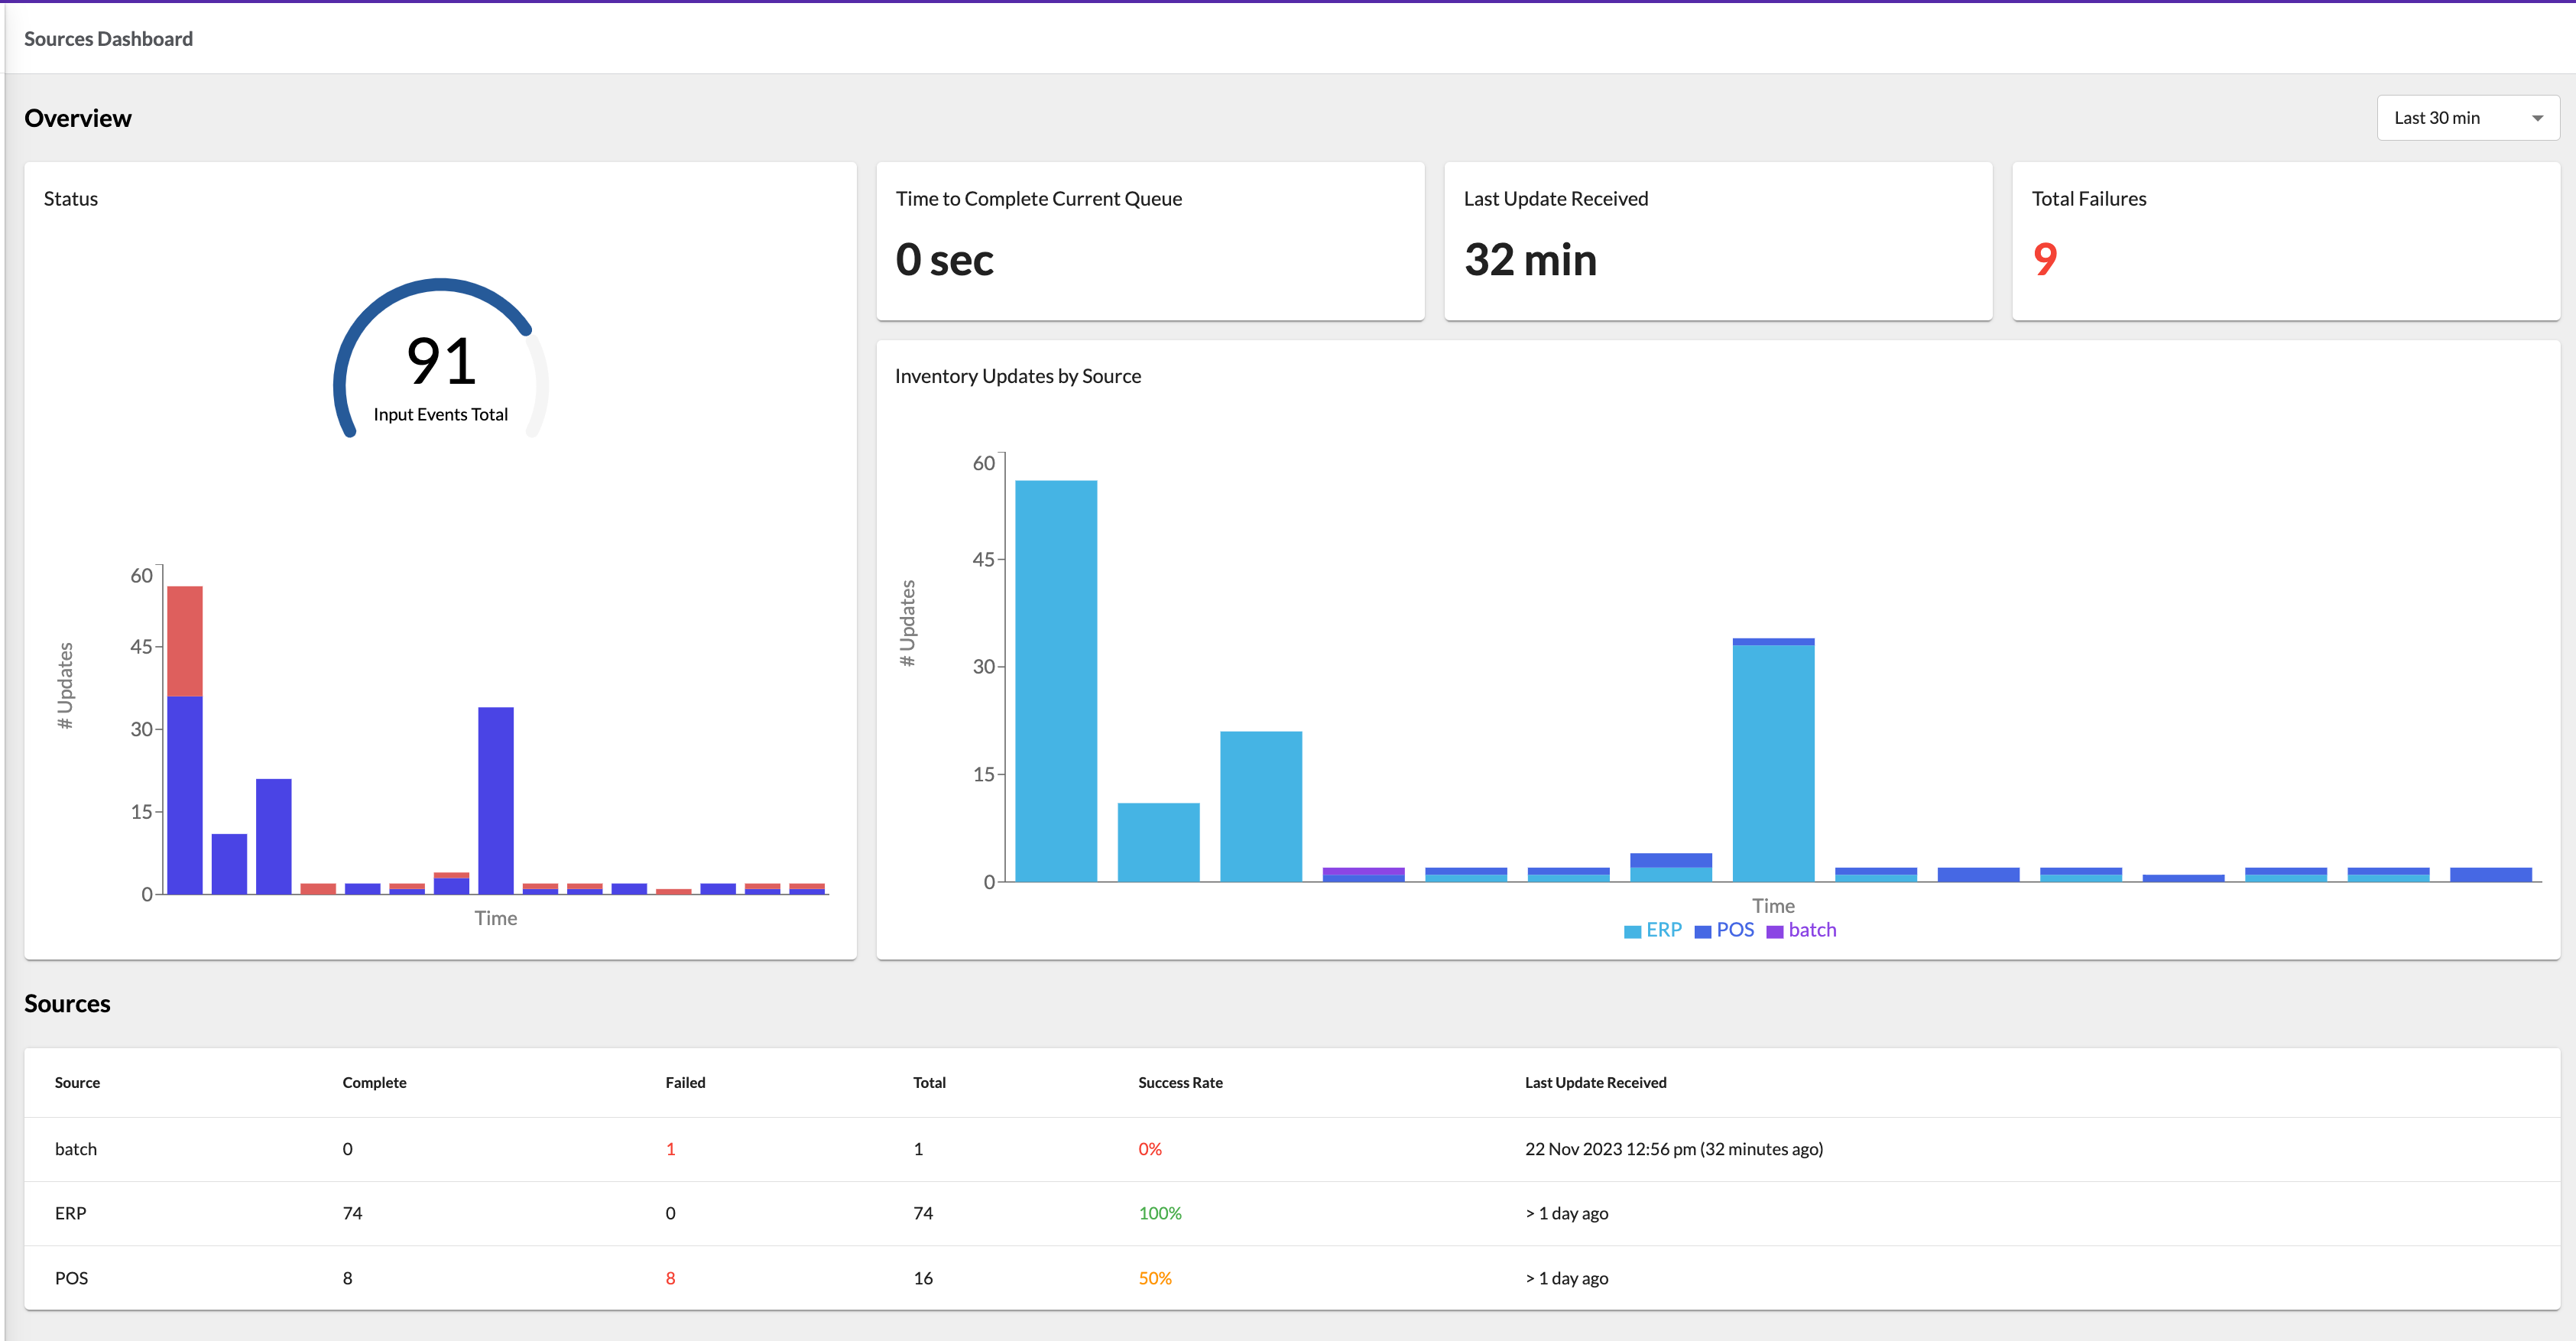
Overview Section
The Overview section contains five cards: Status, Time to Complete Current Queue, Last Update Received, Total Failures, and Inventory Update by Source.
The Status card displays inventory events data for a selected period. The data is presented in 2 charts:
The gauge chart displays the total number of events for the selected period. The chart supports colored thresholds configured via a setting. Read more about colored thresholds in this guide.
The bar chart shows the same data as a gauge chart but is divided by minutes. The chart includes failures, represented with split colors for clarity.

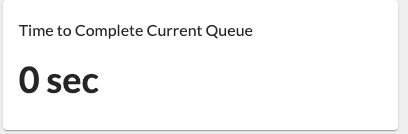
The Time to Complete Current Queue card displays the estimated time required to complete the current queue of updates.
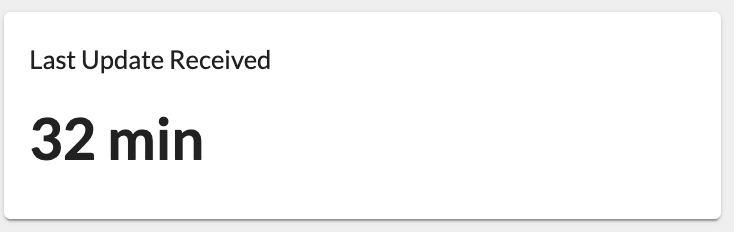
The Last Update Received card displays the time since the last inventory update event was received.
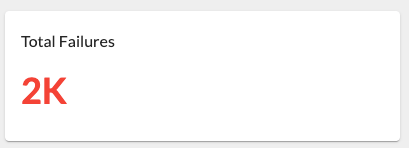
The Total Failures card displays an aggregated number of the Inventory problems or anomalies based on the Metrics data for a selected period.
The Total Failures value is clickable, redirecting to the Events page pre-filtered to enable users to identify the specific Inventory Events that have failed.
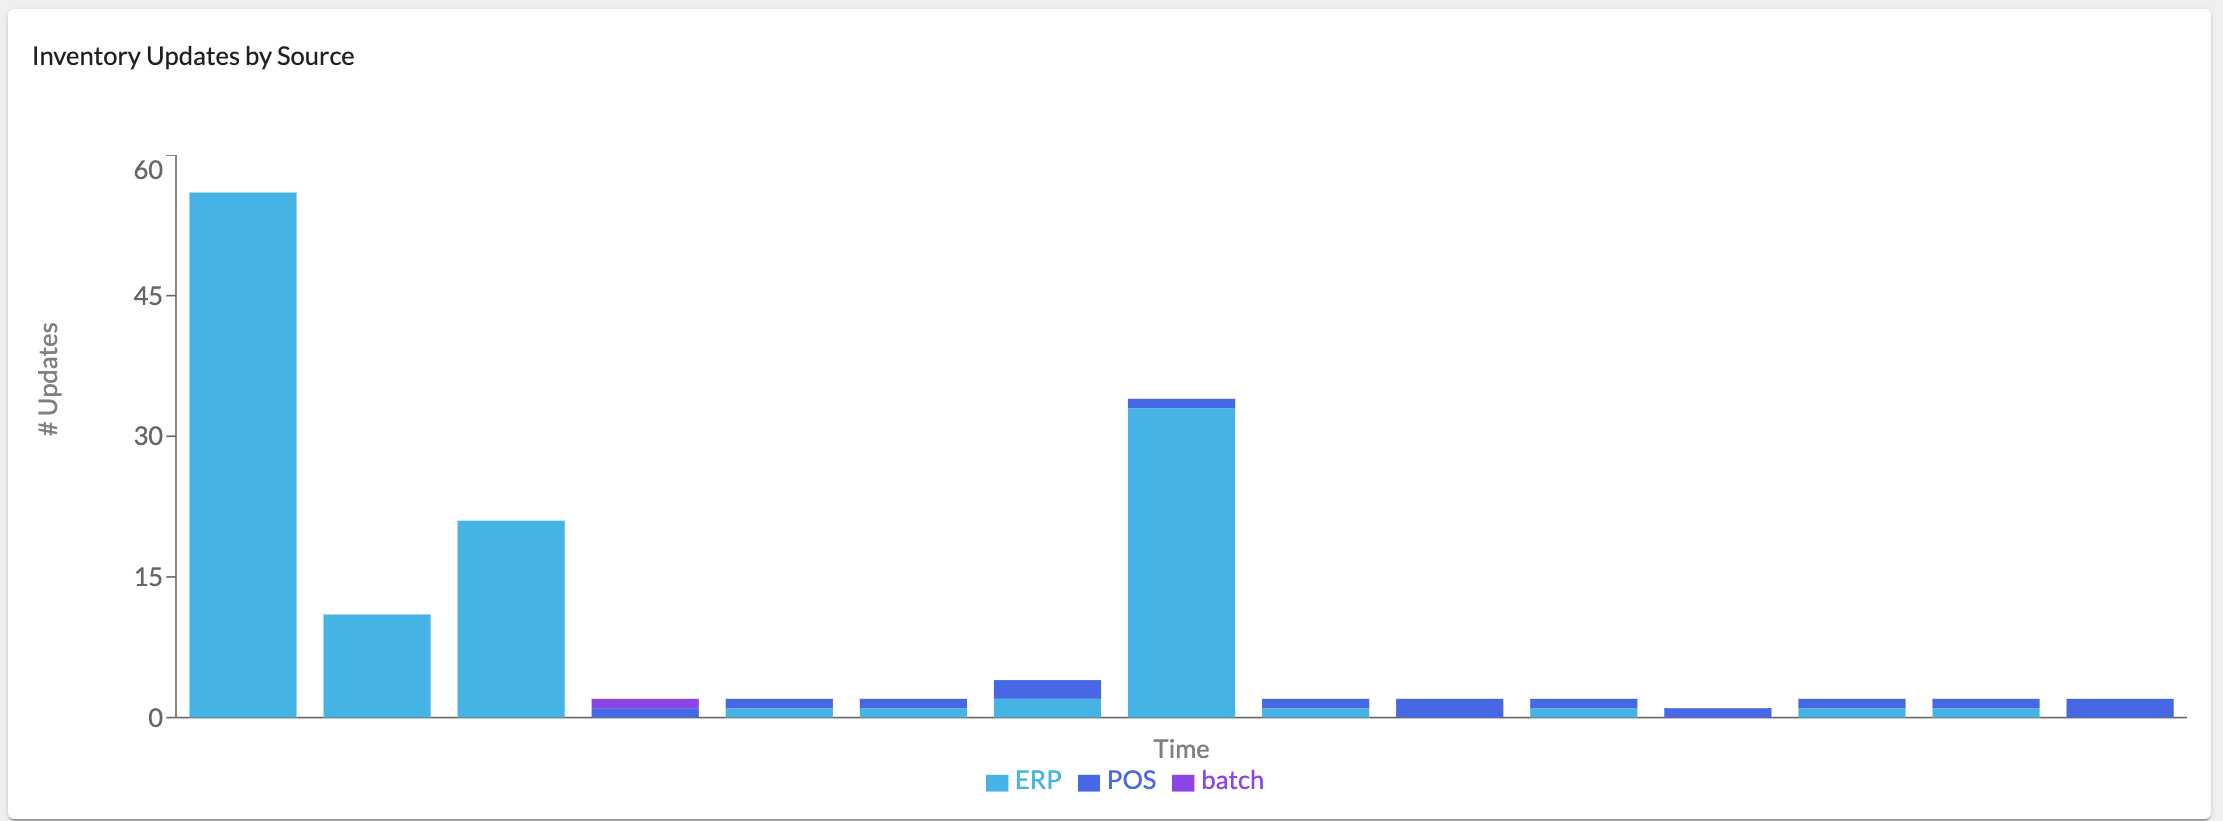
The Inventory Update by Source card displays inventory event data for a selected period divided by sources.
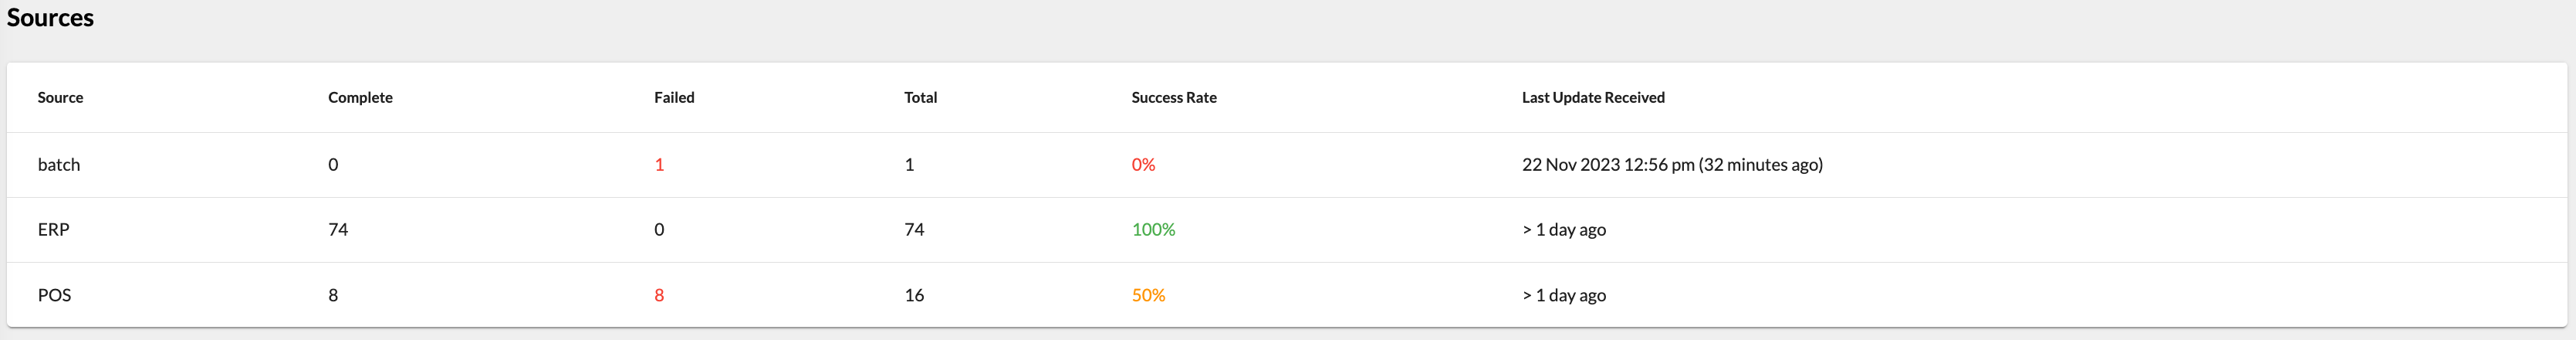
Sources Section
Inventory-related metrics data represents events by different sources (e.g., batch, ERP, POS, etc.). The source is an event attribute.
The Sources section contains a table with the listed inventory sources. The table displays the following information:
- Source - The source system that submitted an inventory update event;
- Complete - The number of successfully completed inventory updates (all statuses except and
`FAILED`);`NO_MATCH` - Failed - The number of inventory updates with and
`FAILED`statuses;`NO_MATCH` - Total - The total number of Inventory updates of a particular source;
- Success Rate - A rate calculated by formula: (complete inventory updates / total inventory updates) * 100% ;
- Last Update Received - The last inventory update. If the last update was too long ago (more than 24 hours) or not returned,"> 1 day ago" is displayed in the column.