Exploring Data Behind Metrics in Analytics Studio
How-to Guide
Author:
Yulia Andreyanova
Changed on:
22 June 2026
Key Points
- You can investigate the data behind dashboard metrics by opening the Explore view
- Clicking a metric value opens the Explore view, where you can review the records contributing to the metric
- The Explore view helps identify patterns and root causes
- Access to Analytics Studio and dashboards depends on your assigned roles and permissions
Steps
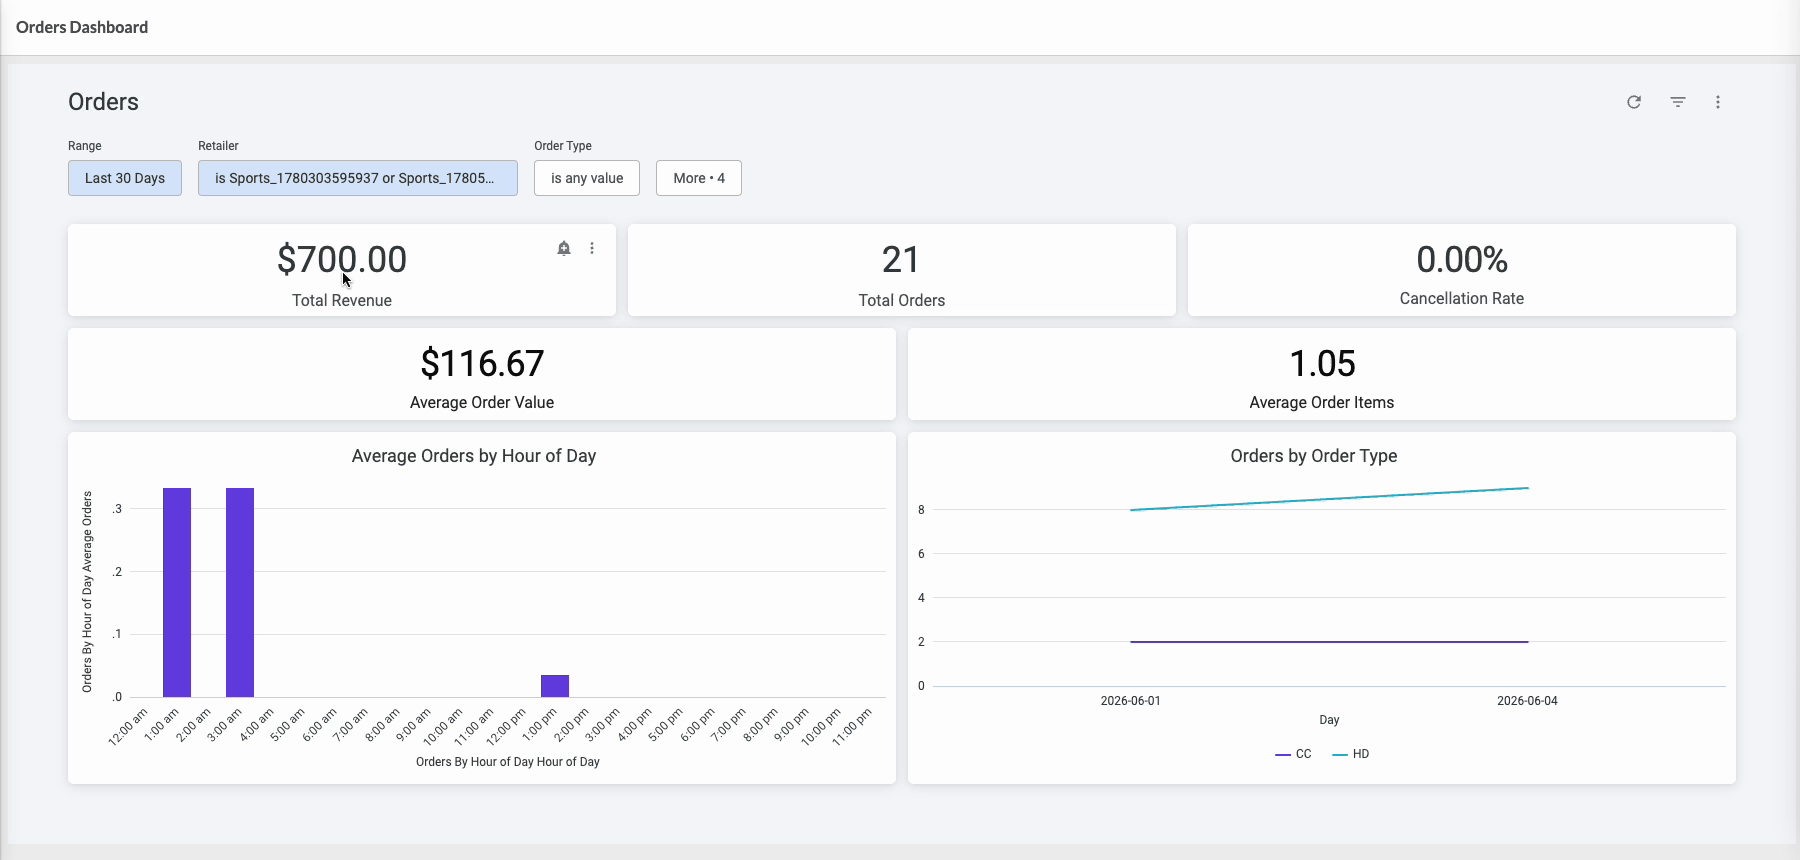
 Open a dashboard and select a metric
Open Analytics Studio either by navigating directly to the URL or via the context switcher in Fluent OMS or Store, then select the Orders Dashboard. Locate the Total Revenue metric.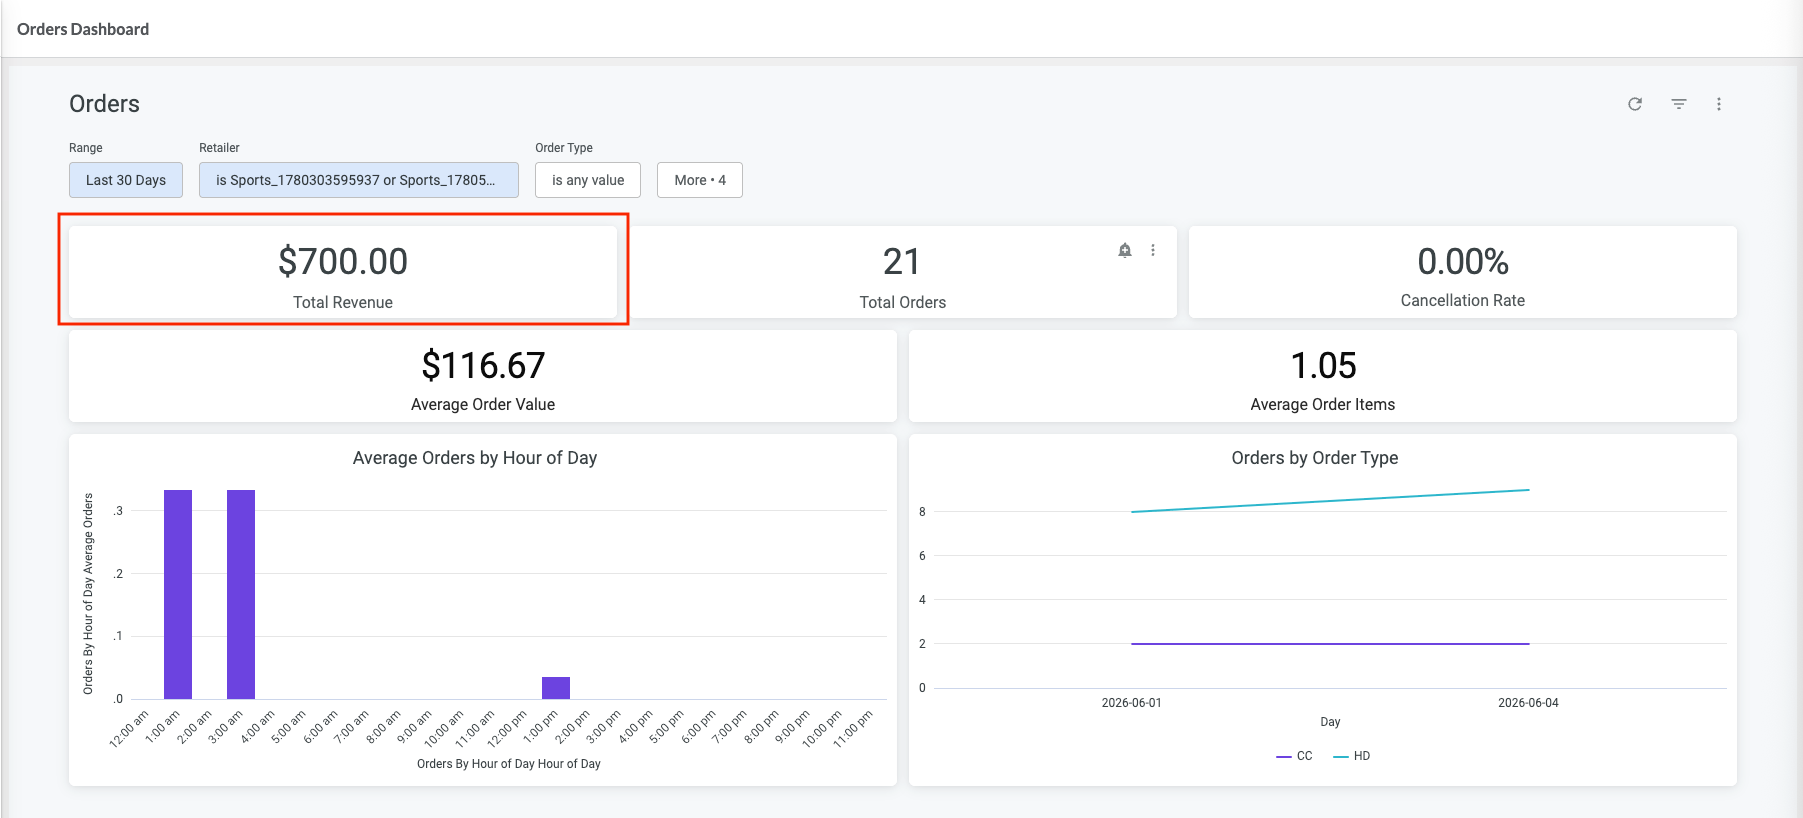
Open the Explore view
Click the metric value on the tile. The Explore view opens, showing the records contributing to the selected metric. When you finish reviewing the data, click X in the top-right corner to return to the dashboard.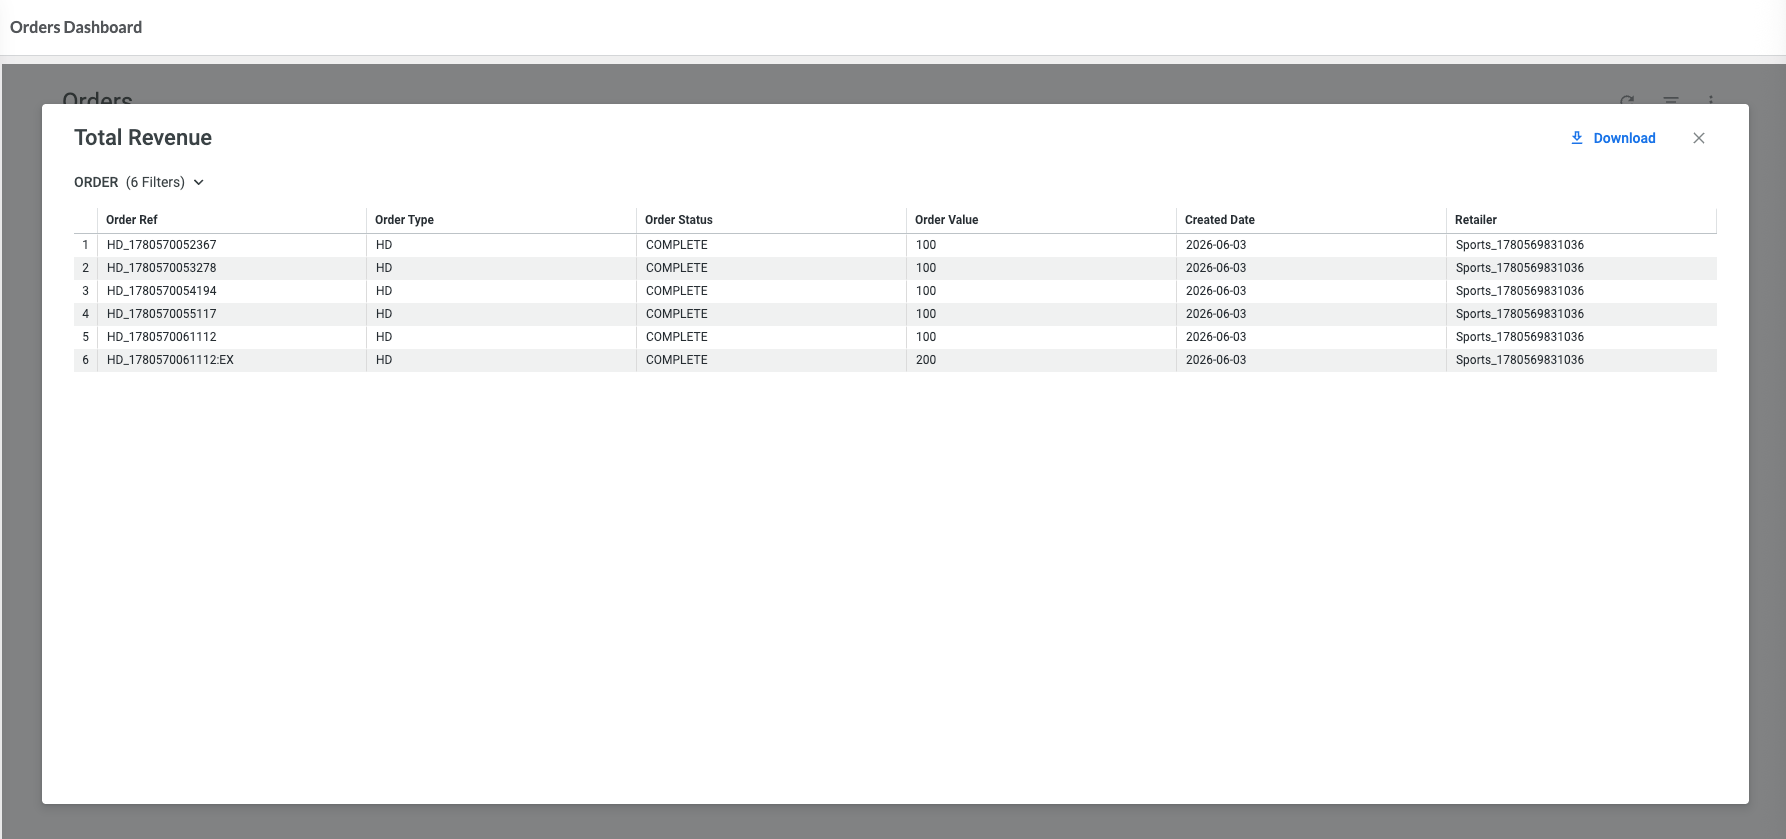
Identify patterns
Review the records to identify trends, anomalies, or other factors contributing to the metric value. Look for:
- changes in the number of orders
- changes in order value (e.g., fewer high-value orders)
- differences in order status (e.g., fewer completed orders)
- shifts across time periods
Result
You can identify the records contributing to the metric and understand what is driving the changes.
Next Steps
Once you identify the relevant records, you can export the data for further analysis. See Exporting Data from Analytics Studio.