Reports page
Essential knowledge
Author:
Yulia Andreyanova
Changed on:
19 Sept 2024
Overview
Discover how the Reports page in the Big Inventory Web App enables understanding an account Inventory Position Update and Inventory Position Change usage for selected periods.Key points
- The reports provided enable a user to understand an account Inventory Position Update and Inventory Position Change usage for selected periods of time
- These usage metrics are split into two different reports so the user can analyze the metric that is most important
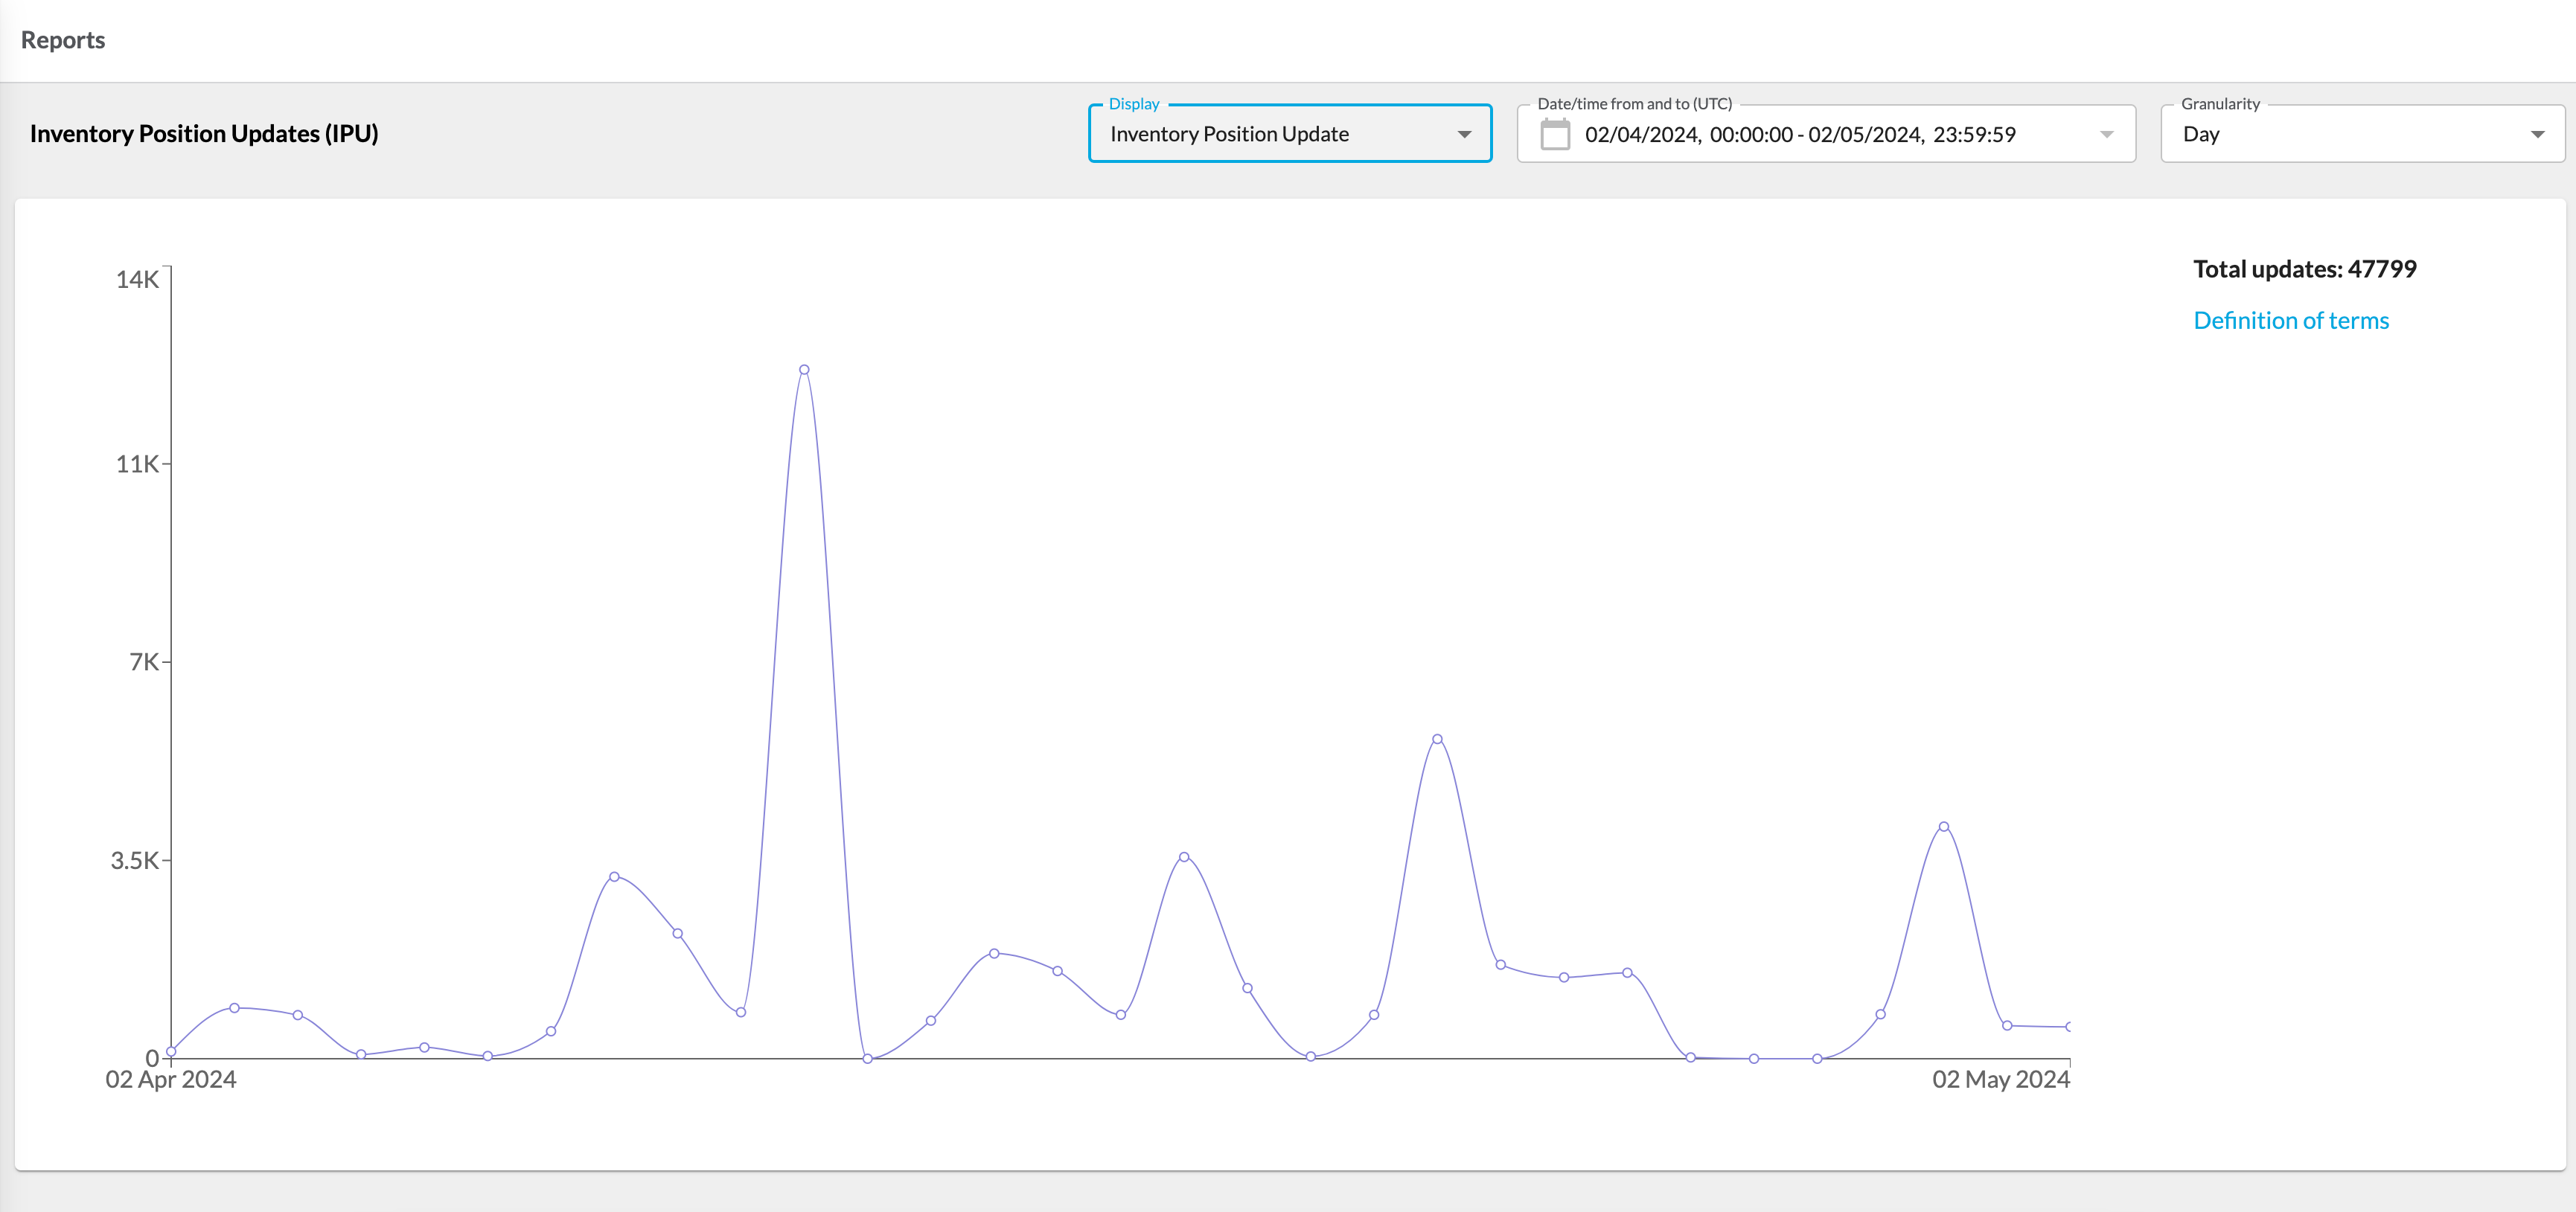
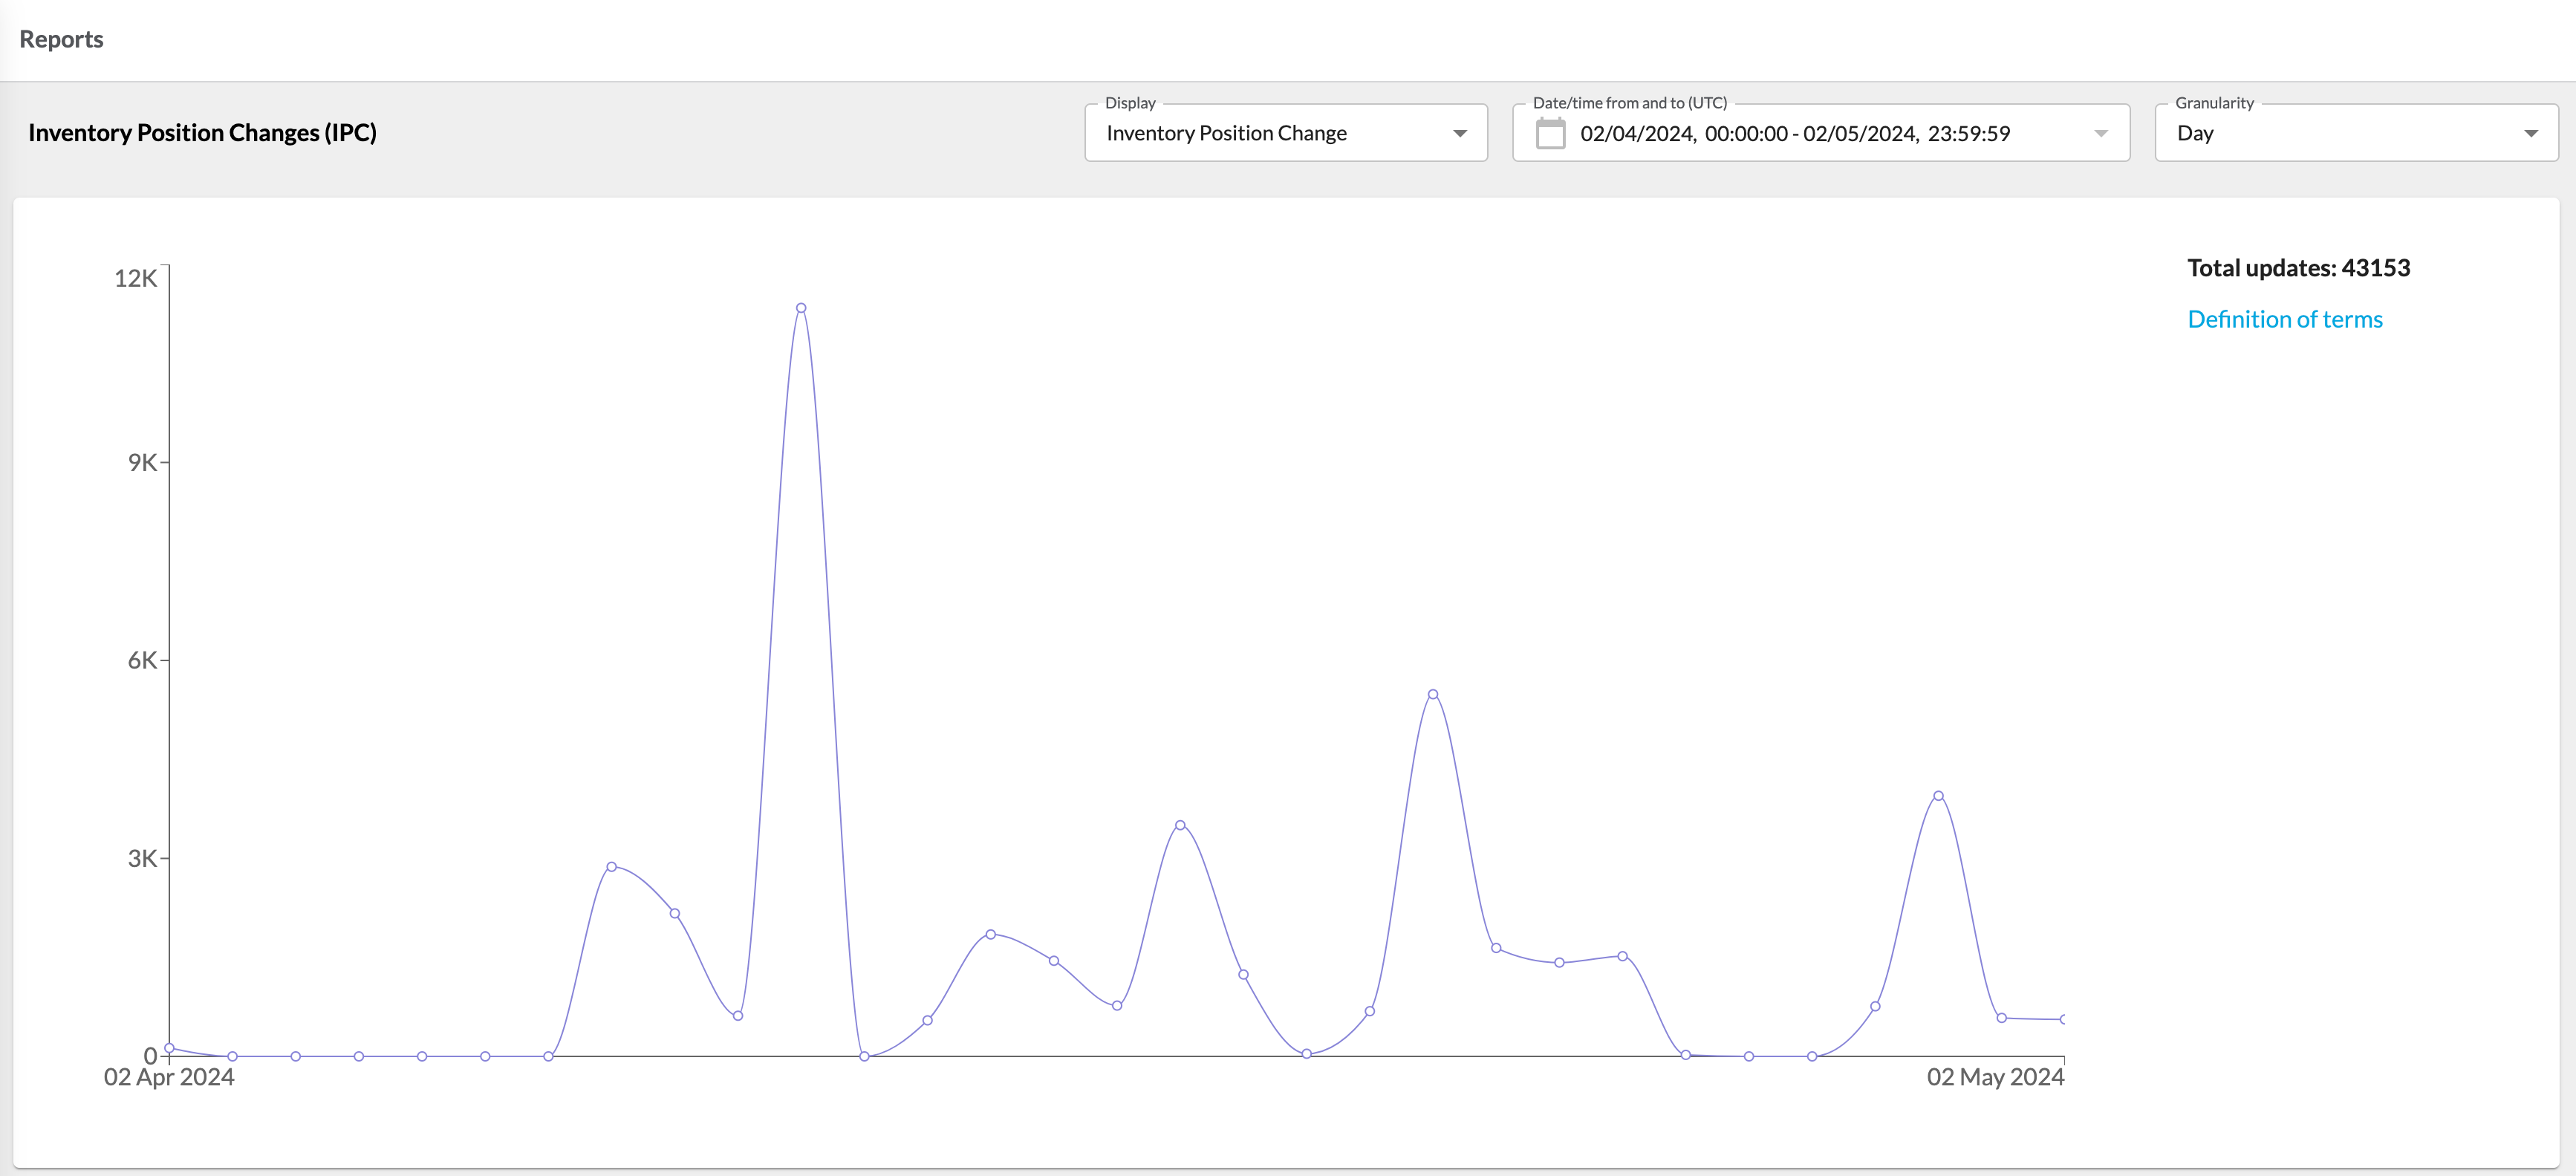
The reports page within the Admin user interface in Fluent OMS provides a visual reporting tool for an account's Inventory Position Update (IPU) and Inventory Position Change (IPC) usage.Two reports, Inventory Position Update and Inventory Position Change, are available here. These reports visualize an account's IPU and IPC usage based on selected parameters such as report type, time frame, and granularity.
 Each report displays the total number of updates. By default, the page displays the Inventory Position Update Report for the preceding 31 days, set to Day granularity. UTC time is utilized for data selection and display.

 Each report displays the total number of updates. By default, the page displays the Inventory Position Update Report for the preceding 31 days, set to Day granularity. UTC time is utilized for data selection and display.
Report Restrictions
When generating reports, it's important to consider several technical constraints. Regardless of the report type, data beyond 185 days old cannot be displayed. If the selected date range exceeds this limit, the chart won’t be generated, and an error message will prompt the user to reduce the timeframe:The maximum time frame is 185 days. Please reduce the total time frame.Furthermore, the chosen granularity limits the acceptable date/time range. These limits are:- For Minute granularity, the selected range should not surpass 12 hours.
- For Hour granularity, the range should not exceed 31 days.

