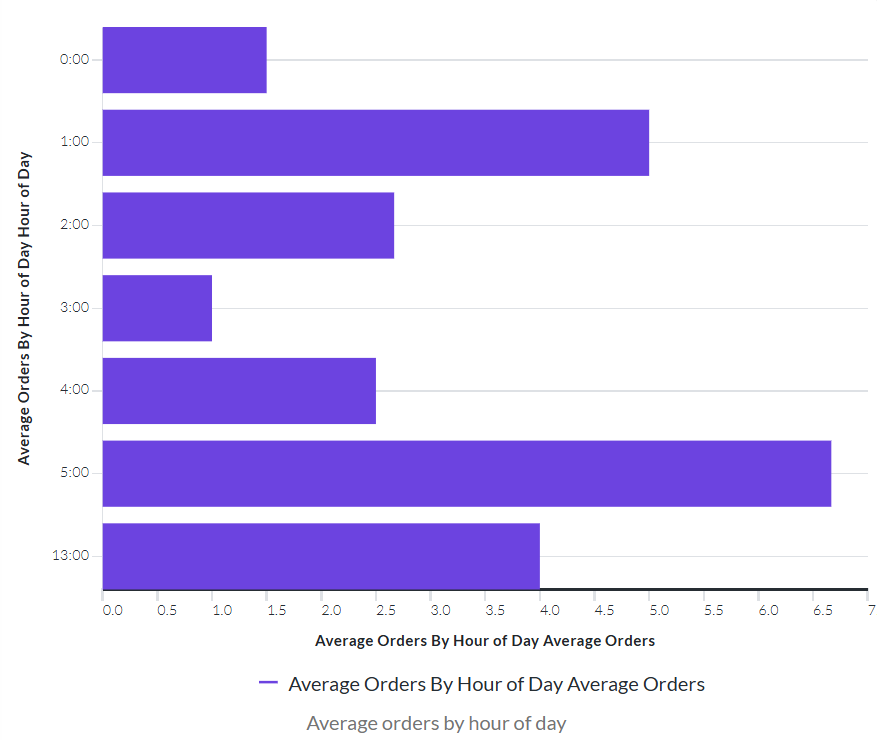
Average Orders by Hour of Day Metric
How-to Guide
Author:
Movyn John
Changed on:
16 Sept 2025
Key Points
- Average number of orders received during each hour across a 24 hour period.
Steps
 What it measures
Average number of orders received during each hour across a 24 hour period.
When to use this metric
- Plan customer service staffing levels
- Optimize website maintenance windows
- Schedule marketing campaigns for peak traffic times
- Understand customer behavior patterns
How to interpret
- Good performance: Clear patterns that align with business expectations
- Potential issues: Unexpected peaks may indicate system issues or unusual events
- Benchmark guidance: Patterns vary by market; typical peaks are during lunch and evening hours
Key considerations
- Time zone differences affect interpretation for multi-region retailers
- Seasonal and promotional events can significantly alter normal patterns
- Weekday vs. weekend patterns typically differ substantially
Technical details
Formula:
SUM(order.items.quantity) / COUNT(orders) within the selected time period
Configurable elements:
- none