Analytics Visualisation Component
UI Component
Changed on:
16 Jan 2026
Overview
The Analytics Visualisation Component displays a single analytics query result from the Fluent Analytics Backend. It renders metric tiles and visualizations based on configured Analytics Queries settings.Depending the configuration, this component can be placed standalone on a page, where it will make its own GraphQL query, or it can also read data from the page level query. This is useful when analytics data is the main content on the page.| Plugin Name | analytics-plugin |
|---|
Alias
fc.analytics.viz
Detailed technical description
Prerequisites
- Fluent Analytics enabled in the Account
- Analytics Query setting(s) configured (Configuration Guide)
- Analytics UI plugin is available
- User has required permissions (Analytics Permissions)
- Understanding of query structure (Analytics Query Structure)
Usage Patterns
Pattern 1: Standalone Mode
Use when embedding a single metric on any page (e.g., key metrics on an operational page).1{
2 "component": "fc.analytics.viz",
3 "props": {
4 "name": "orders_total_revenue",
5 "useOwnQuery": true,
6 "label": "Total Revenue",
7 "width": "third"
8 }
9}- Component makes its own GraphQL query using the
`name`property - Query executes independently when component is initialized
Pattern 2: Dashboard Mode (Recommended for Multiple Metrics)
Use when displaying multiple analytics visualizations that share filter state.1query AnalyticsDashboard(
2 $targets: [AnalyticsTarget!]!,
3 $timezone: String
4) {
5 analytics(targets: $targets, timezone: $timezone) {
6 results
7 }
8}1{
2 "targets": [
3 {
4 "name": "orders_total_revenue",
5 "parameters": [
6 {
7 "key": "order.created_date",
8 "value": ["{{params.orders_created_on}}"]
9 },
10 {
11 "key": "retailer.ref",
12 "value": ["{{readArrayFromParams 'retailer_ref[]'}}"]
13 }
14 ]
15 },
16 {
17 "name": "orders_total_orders",
18 "parameters": [...]
19 }
20 ],
21 "timezone": "{{context.account.timezone}}"
22}1{
2 "component": "fc.analytics.viz",
3 "dataSource": "analytics.results.orders_total_revenue",
4 "props": {
5 "name": "orders_total_revenue",
6 "label": "Total Revenue",
7 "width": "third"
8 }
9}- All visualizations share a single page-level query
- Filter changes trigger one query update for all components on the page
- Required for integration with filter components
Query Structure
The component uses analytics queries with a specific naming format and structure. For complete query structure details, see Analytics Query Structure.Query Name FormatQuery names follow the pattern:
`{query_group}_{query_name}`Examples:`orders_total_revenue``fulfilments_fulfilment_by_location``inventory_total_on_hand`
To reference query results in dashboard mode, use dot notation:
`analytics.results.{query_group}_{query_name}`1{
2 "component": "fc.analytics.viz",
3 "dataSource": "analytics.results.orders_total_revenue",
4...
5}Troubleshooting
This section details how a technical user can troubleshoot the analytics visualisation component. This is aimed at users with some familiarity with fluent's data model and browser tools for First, check if there is an error message that shows up on the page. It may provide more details on what went wrong or direct you to next steps towards figuring out the exact error.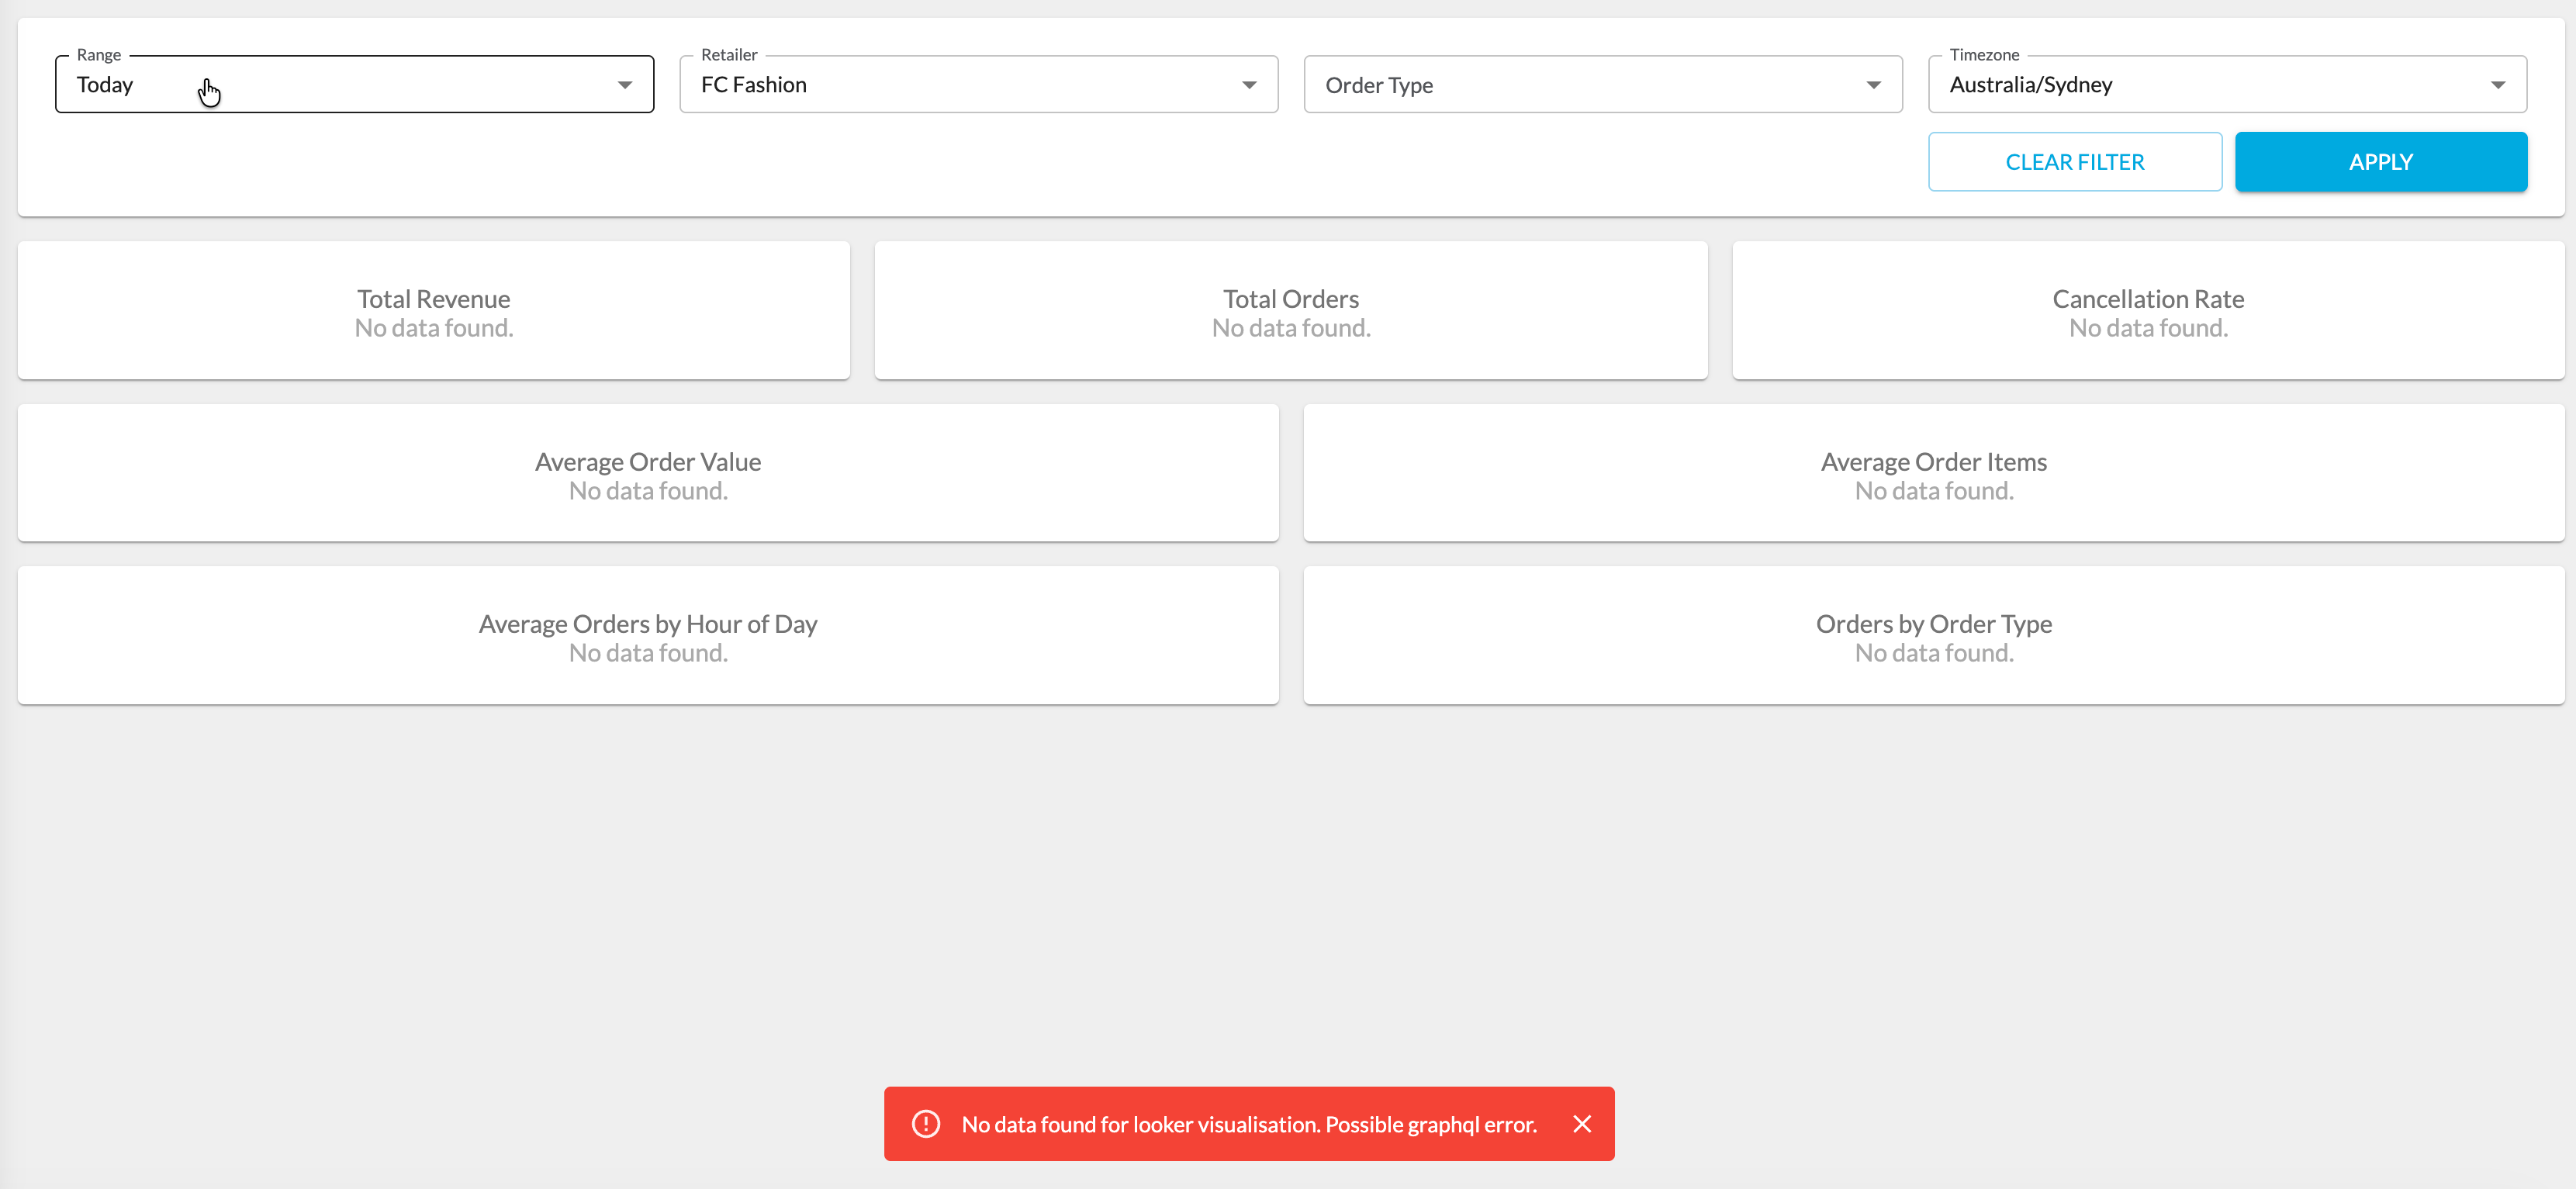
No Error Message - Check Data Exists
In the case where no error message pops up, double check if there is any data in the time range selected. The dashboards default to 'today', which means only data relevant to 'today' will show up. This starts from midnight of the current day to the current time.Insufficient Permissions
This error message is a graphql error message and can be found in the networks tab of most browser developer tools.The user must have the relevant permissions to view the analytics data. If the user has insufficient data priveleges, the graphql request will error out, and an error message can be found in the network tab of browser developer tools. Double check the logged in user has both the
`ANALYTICS_VIEW` permissions, and the roles necessary to view the metrics on the page as per the Query Settings for the metrics.Query Alias Does Not Exist
This error message is a graphql error message and can be found in the networks tab of most browser developer tools.This error message means that it could not find the analytics query with the name specified. The most likely cause of this is a configuration error. Double check the name of the analytics target (in the graphql query) against the documented name on Fluent Docs. Additionally, also make sure the target name structure is correct. It should be of the form <query_group>_<query_name> e.g. orders_total_revenue. See Analytics Query Structure for more details.
Undefined Error
If there is no specific error, this means the issue is something unexpected with the Fluent Analytics Backend. Contact a member of our support team and we will investigate further.Properties
| Name | Type | Required | Default | Description |
| name | string | Conditional* | - | Analytics query identifier using format `{query_group}_{query_name}`. Used as React component ID for accessibility, therefore it is recommended to us uniqe names for each occurence. *Required when `useOwnQuery: true` |
| label | string | No | - | Display label shown beneath the visualization |
| useOwnQuery | boolean | No | false | true: Component executes its own GraphQL query false: Component reads from page-level query |
| dataSource | string | Conditional** | - | Path to query result in page-level query response. Format: `analytics.results.{query_name}`. **Required when `useOwnQuery: false` |
| width | string | No | - | Display width (e.g., `"third"`, `"half"`, `"full"`) |
Configuration example
1{
2  "component": "fc.analytics.viz",
3  "dataSource": "analytics.results.orders_total_orders",
4  "props": {
5    "name": "orders_total_orders",
6    "width": "third",
7    "label": "Total Orders"
8  }
9}Version History
Recommended Placement
Operational Pages
Embed 1-3 key metrics contextually on operational pages.Configuration:- Set
`useOwnQuery: true`(independent queries) - Use
`width`property for layout control - Position near related operational data
- Order Search page: Display daily order volume, revenue
- Inventory Management page: Display low stock alerts, coverage days
- Fulfilment Dashboard: Display pick rate, on-time shipment rate
Analytics Dashboard Pages
Display 4+ related metrics on a dedicated analytics page.Configuration:- Set
`useOwnQuery: false`(use page-level query) - Pair with Filter component
- Organize with layout components (Container, Grid)
- Orders Dashboard: Display total orders, total revenue, average order value etc.
- Fulfilment Dashboard: Display average fulfilment time, fill rate, top 10 products fulfilled etc.
- Inventory Dashboard: Display total on-hand, total availability, top 10 reserved products etc.
- Returns Dashboard: Display return rate, average return order value, total return amount etc.