Fluent Commerce Logo
Docs
Sign In

Configure ServicePoint Dashboard

How-to Guide

Author:

Fluent Commerce staff

Changed on:

13 Dec 2023

Key Points

  • Overview
  • Configuring the Dashboard
  • User Role and Permission
  • Understanding Dashboard View
  • Customization Example

Steps

Step arrow right iconOverview

The configurable dashboard on the ServicePoint provides a comprehensive view of key information about orders and fulfillment and their statuses at any instance. Using this capability the in-store staff can monitor fulfilments awaiting to be picked at their store, plan the pick and pack process, and plan the pending tasks. The dashboard also provides visibility to the retail managers to analyze the performance of the store.

This dashboard has tiles which display total count of orders and their statuses for a configured time range. For example, a tile can display the total count of orders in the Awaiting Pick status for 1 week at a specific location.

Step arrow right iconConfiguring the Dashboard

To configure the ServicePoint Dashboard, the Dashboard component needs to be configured in a setting called 

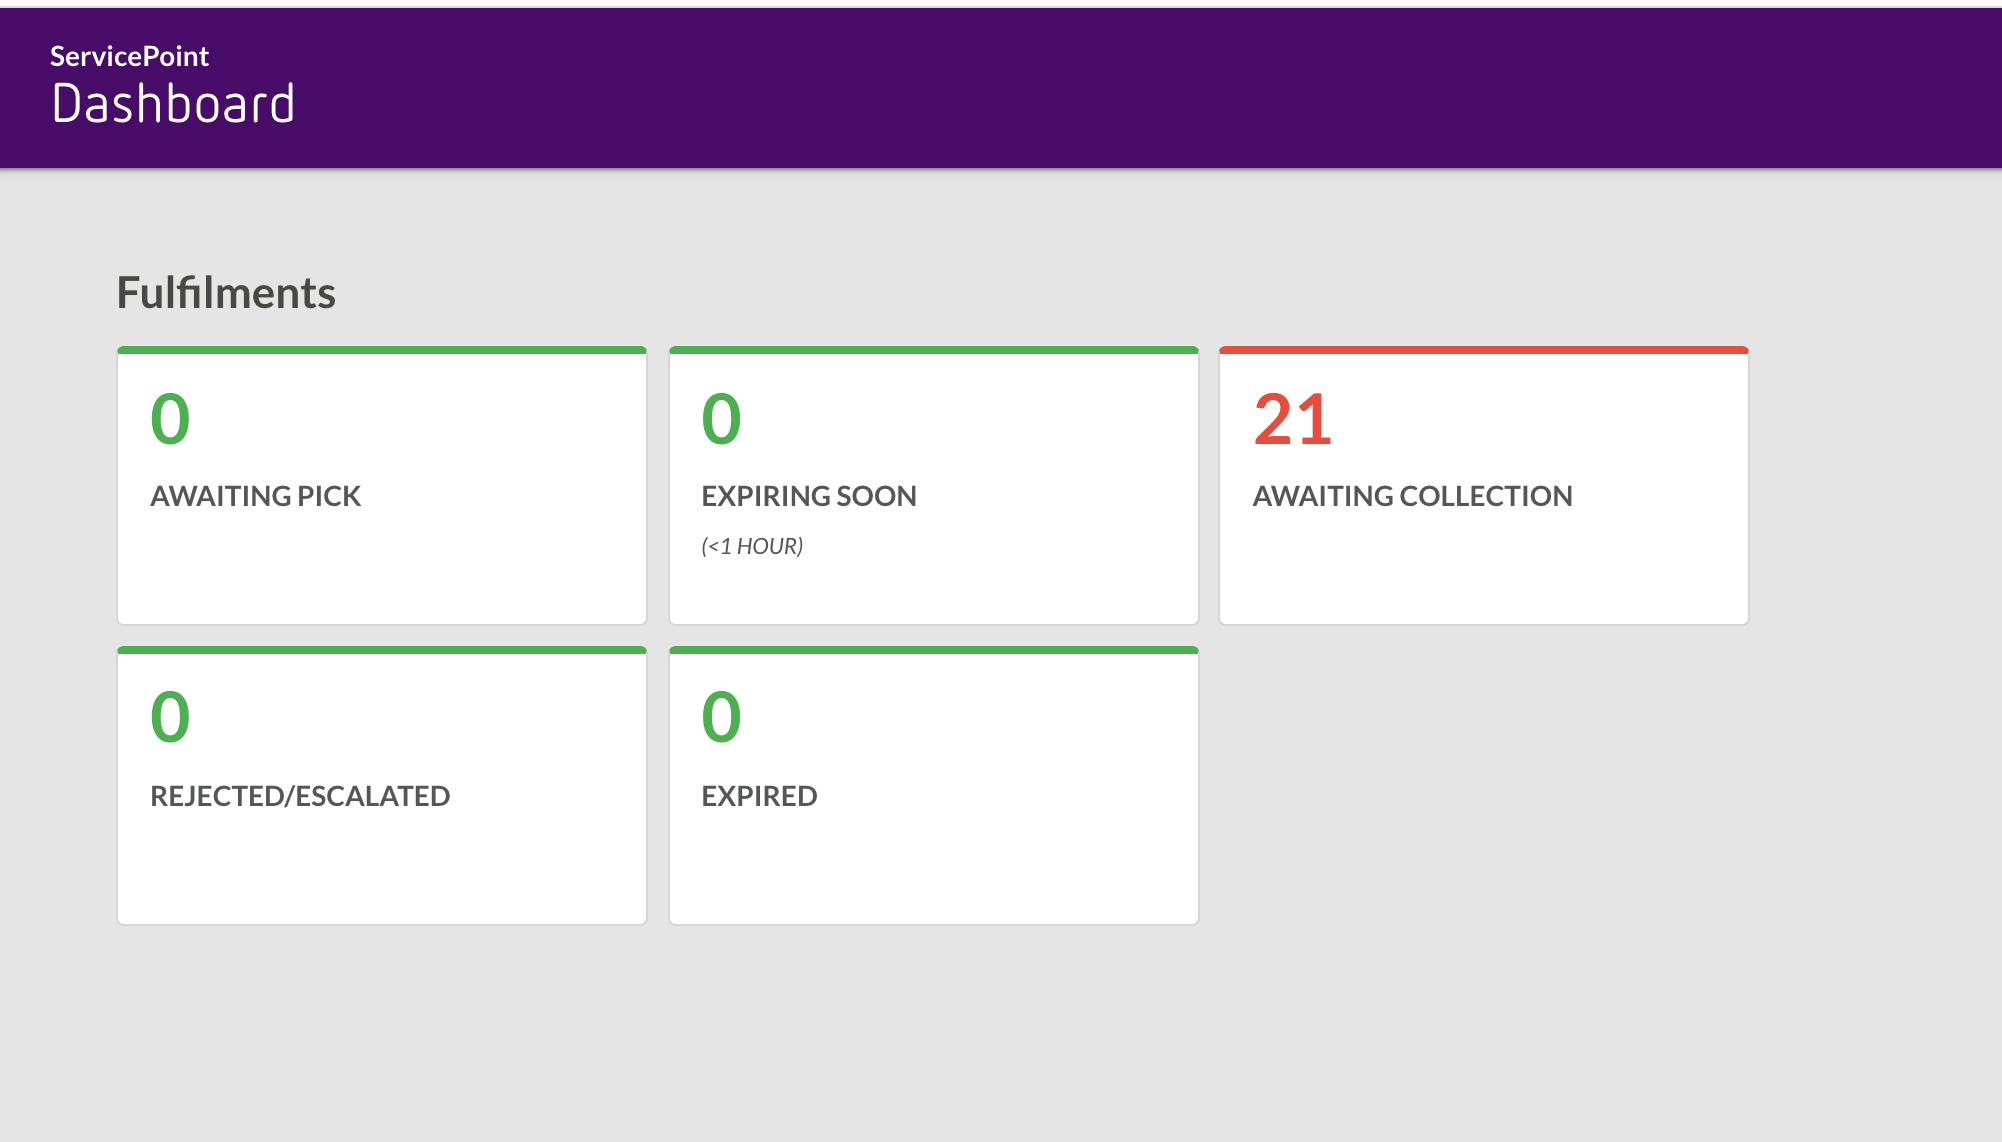
`SERVICEPOINT_GQL_DASHBOARD`
 within the Account at the Retailer context.

The component will render the tiles based on the GraphQL Queries and SLA Parameters configured in the setting.

No alt provided
JSON Setting Configuration

The following is a snippet of the Setting value, showing the GraphQL Query and Dashboard configurations.

In this example, a single tile would be displayed showing the number of fulfilments in the 

`AWAITING_PICK`
 status in the last 7 days. Additional statuses and time ranges can be configured to meet Client requirements.

1{
2    "key":"SERVICEPOINT_GQL_DASHBOARD",
3    "lob_value":{
4        "gql":{
5                "query":"query dashboardData($locationRef: String!, $pickedFromDate: DateTime!) { ordersAwaitingPick: fulfilments(first: 100, status: \"AWAITING_WAVE\", fromLocation: {ref: $locationRef}, updatedOn: {from: $pickedFromDate}) { pageInfo { hasNextPage } edges { node { id status } } }}",
6                "variables":{
7                    "pickedFromDate":"{{dateStringFormatter (dateAdd day=-7) 'YYYY-MM-DD[T]HH:mm:ss.SSS[Z]'}}"
8                }
9            },
10        "dashboard":{
11            "title":"My GQL Dashboard",
12            "sections":[
13                {
14                    "title":"Fulfilments",
15                    "tilesPerRow":1,
16                    "tiles":[
17                        {
18                            "key":"ordersAwaitingPick",
19                            "title":"AWAITING_PICK",
20                            "sla":"(7 Days)",
21                            "displayTemplate":"{{ordersAwaitingPick.edges.length }}",
22                            "thresholdLow":0,
23                            "thresholdHigh":1,
24                            "link_template":"#/pickandpack"
25                        }
26                    ]
27                }
28            ]
29        }
30    }
31}

Language: json

Name: Example

Description:

[Warning: empty required content area]
  • On line 5, the query configures the entity (
    `fulfilments`
    ), status (
    `AWAITING_PICK`
    ), and date fields (
    `updatedOn: { to: $pickedFromDate }`
    ) for the SLA.
  • On line 7, the variables configures the 
    `$pickedFromDate`
     date parameter, in this case using a date range of 7 days. The 
    `dateAdd`
     directive supports 
    `min`
    `hours`
    , or 
    `days`
    .
  • Line 11 sets the page title for the Dashboard.
  • Line 14 sets the section title.
  • Line 15 defines how many tiles are displayed per section.
  • Line 19 sets a tile title.
  • Line 20 sets the SLA display text for the tile.
  • Line 21 defines the value to display from the dynamic query.
  • Line 24 defines the link for the tile, that when click will navigate to a new page.

Step arrow right iconUser Role and Permission

To access the ServicePoint dashboard, a location user must have the 

`DASHBOARD_VIEW`
 permission enabled in the 
`AGENT`
 context.

This permission can be added to any existing role at a specific location or can be assigned to a new role.

Step arrow right iconUnderstanding Dashboard View

The in-store staff can view information such as number of orders, fulfillment statuses on the dashboard tiles. The data on tiles is refreshed based on the time range specified in the Dashboard setting topic. The threshold limits are configurable numeric values which are compared with the total number of entities filtered by status and SLA for a specific time.

The colors of the tiles are displayed based on the threshold values as explained in the table below:

A Store Operations Manager can configure the threshold values based on the Pick & Pack SLAs for their stores. The Store Staff can take relevant actions based on the colors of the tiles.

Data Limit

Tile Color

Action

Less than or Equal to the 

`thresholdLow`
 value.

Green

None

More than thresholdLow and less than 

`thresholdHigh`
 value.

Amber

Attention required.

More than alert thresholdHigh value.

Red

Immediate attention required.

Step arrow right iconCustomisation Example

A retailer wants to have visibility of all orders pending collection in the store.

To meet this requirement, the following steps can be taken:

1. Extend the 

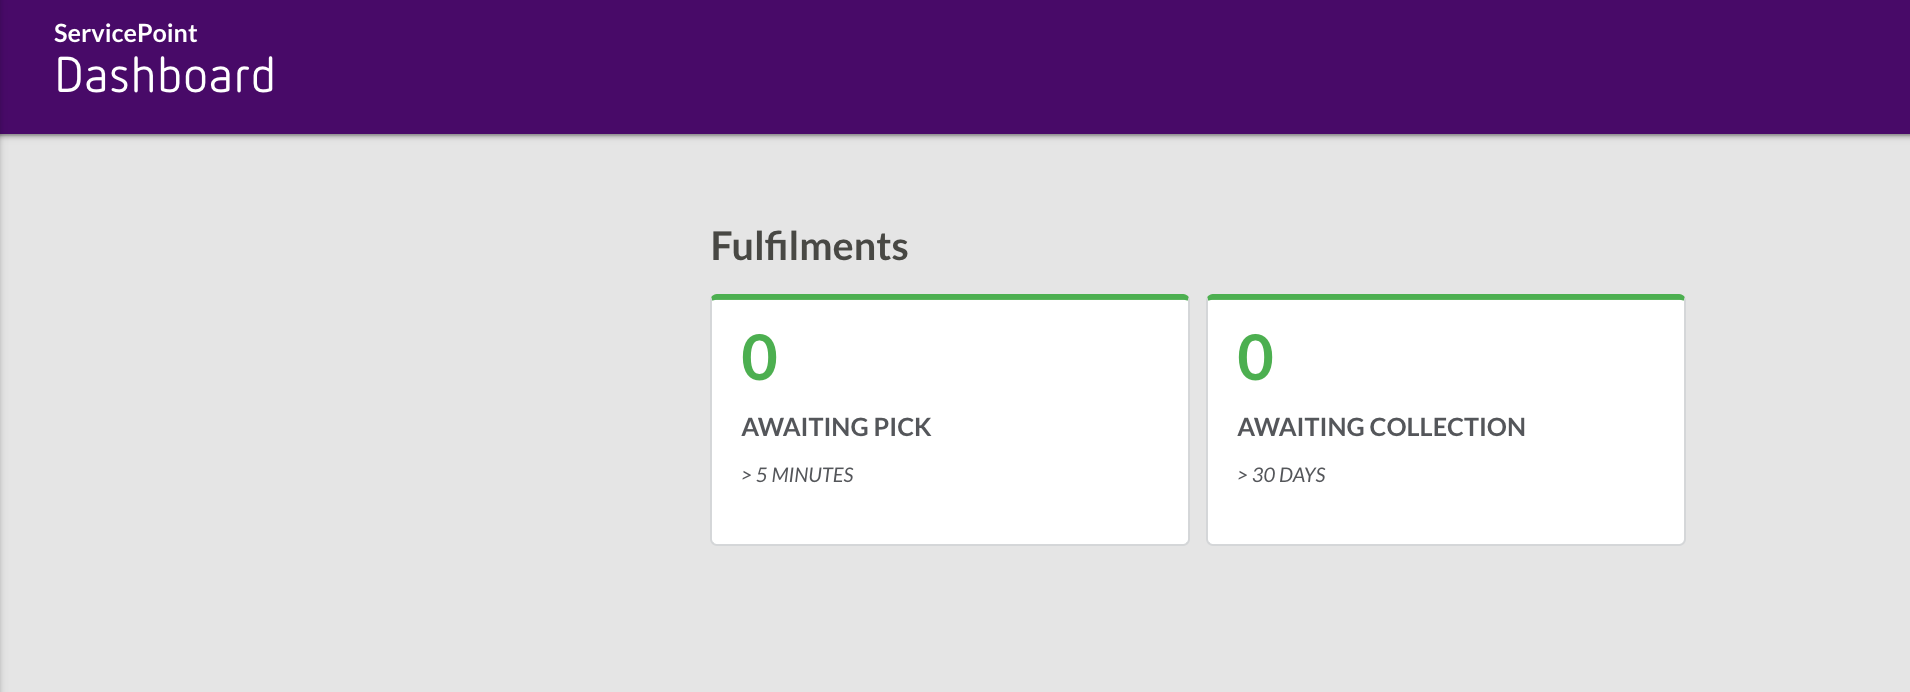
`query`
 by adding a new aliased query which filters Fulfilments in a 
`AWAITING_COLLETION`
 status

1"query": "query dashboardData($locationRef: String!, $pickedFromDate: DateTime!, $collectionFromDate: DateTime!) { ordersAwaitingPick: fulfilments(first: 100, status: \"AWAITING_WAVE\", fromLocation: {ref: $locationRef}, updatedOn: {from: $pickedFromDate}) { pageInfo { hasNextPage } edges { node { id status } } } ordersAwaitingCollection: fulfilments(first: 100, status: \"FULFILLED\", fromLocation: {ref: $locationRef}, updatedOn: {from: $collectionFromDate}) { pageInfo { hasNextPage } edges { node { id updatedOn } } } }",

Language: graphqlschema

Name: Query

Description:

[Warning: empty required content area]

2. Configure the query variable to set the SLA for 30 days:

1"variables": {
2    "pickedFromDate": "{{dateStringFormatter (dateAdd min=-5) 'YYYY-MM-DD[T]HH:mm:ss.SSS[Z]'}}",
3    "collectionFromDate": "{{dateStringFormatter (dateAdd days=-30) 'YYYY-MM-DD[T]HH:mm:ss.SSS[Z]'}}"
4}

Language: json

Name: Variables

Description:

[Warning: empty required content area]

3. Add a new tile definition for the 

`AWAITING_COLLECTION`
 status.

1{
2    "key": "orderAwaitingCollection",
3    "title": "AWAITING_COLLECTION",
4    "sla": "",
5    "displayTemplate": "{{ ordersAwaitingCollection.edges.length }}",
6    "thresholdLow": 0,
7    "thresholdHigh": 10,
8    "link_template": "#/collections"
9}

Language: graphqlschema

Name: New tile definition with the example

Description:

[Warning: empty required content area]
1{
2   "key": "SERVICEPOINT_GQL_DASHBOARD",
3   "lob_value": {
4       "gql": {
5            "query": "query dashboardData($locationRef: String!, $pickedFromDate: DateTime!, $collectionFromDate: DateTime!) { ordersAwaitingPick: fulfilments(first: 100, status: \"AWAITING_WAVE\", fromLocation: {ref: $locationRef}, updatedOn: {from: $pickedFromDate}) { pageInfo { hasNextPage } edges { node { id status } } } ordersAwaitingCollection: fulfilments(first: 100, status: \"FULFILLED\", fromLocation: {ref: $locationRef}, updatedOn: {from: $collectionFromDate}) { pageInfo { hasNextPage } edges { node { id updatedOn } } } }",
6            "variables": {
7                "pickedFromDate": "{{dateStringFormatter (dateAdd min=-5) 'YYYY-MM-DD[T]HH:mm:ss.SSS[Z]'}}",
8                "collectionFromDate": "{{dateStringFormatter (dateAdd days=-30) 'YYYY-MM-DD[T]HH:mm:ss.SSS[Z]'}}"
9           }
10       },
11       "dashboard": {
12           "title": "My GQL Dashboard",
13           "sections": [
14               {
15                   "title": "Fulfilments",
16                   "tilesPerRow": 1,
17                   "tiles": [
18                       {
19                           "key": "ordersAwaitingPick",
20                           "title": "AWAITING_PICK",
21                           "sla": "> 5 Minutes",
22                           "displayTemplate": "{{ordersAwaitingPick.edges.length }}",
23                           "thresholdLow": 0,
24                           "thresholdHigh": 1,
25                           "link_template": "#/pickandpack"
26                       },
27                       {
28                           "key": "orderAwaitingCollection",
29                           "title": "AWAITING_COLLECTION",
30                           "sla": "> 30 Days",
31                           "displayTemplate": "{{ ordersAwaitingCollection.edges.length }}",
32                           "thresholdLow": 0,
33                           "thresholdHigh": 10,
34                           "link_template": "#/collections"
35                       }
36                   ]
37               }
38           ]
39       }
40   }
41}

Language: json

Name: The full configuration combined with the first example

Description:

[Warning: empty required content area]
Customised Dashboard
No alt provided
Fluent Commerce staff

Fluent Commerce staff

Copyright © 2024 Fluent Retail Pty Ltd (trading as Fluent Commerce). All rights reserved. No materials on this docs.fluentcommerce.com site may be used in any way and/or for any purpose without prior written authorisation from Fluent Commerce. Current customers and partners shall use these materials strictly in accordance with the terms and conditions of their written agreements with Fluent Commerce or its affiliates.

Fluent Logo